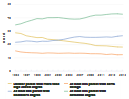
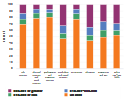
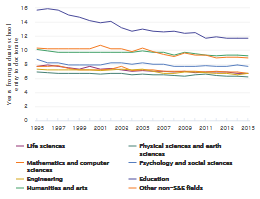
The time between entering graduate school and earning the doctorate has fallen in all fields of study over the past 20 years, particularly in education. Since 2005, the declines in the duration of study of doctorate recipients in non-S&E fields have exceeded the declines in the duration of study of S&E doctorates. Despite these trends, it still takes years longer to earn a doctorate in non-S&E fields than it does to complete doctoral training in S&E fields (figure F).
Median time to degree of U.S. doctorate recipients, by broad field of study: 1995–2015
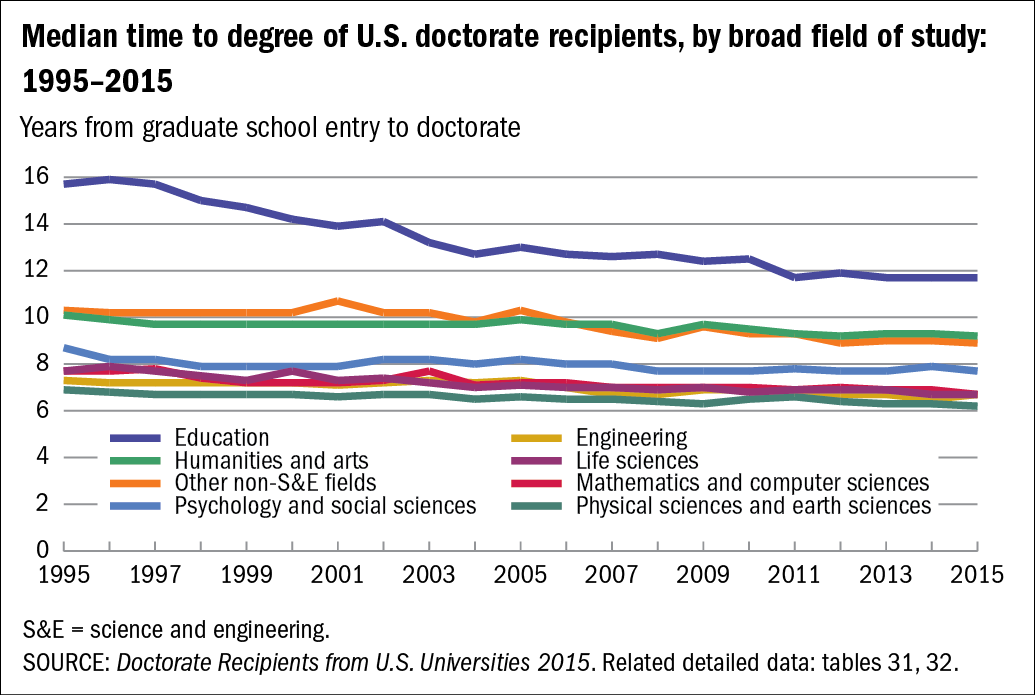
| Year | Life sciences | Physical sciences and earth sciences | Mathematics and computer sciences | Psychology and social sciences | Engineering | Education | Humanities and arts | Other non-S&E fields |
|---|---|---|---|---|---|---|---|---|
| 1995 | 7.7 | 6.9 | 7.7 | 8.7 | 7.3 | 15.7 | 10.1 | 10.3 |
| 1996 | 7.9 | 6.8 | 7.7 | 8.2 | 7.2 | 15.9 | 9.9 | 10.2 |
| 1997 | 7.7 | 6.7 | 7.8 | 8.2 | 7.2 | 15.7 | 9.7 | 10.2 |
| 1998 | 7.5 | 6.7 | 7.4 | 7.9 | 7.2 | 15.0 | 9.7 | 10.2 |
| 1999 | 7.3 | 6.7 | 7.2 | 7.9 | 7.2 | 14.7 | 9.7 | 10.2 |
| 2000 | 7.7 | 6.7 | 7.2 | 7.9 | 7.2 | 14.2 | 9.7 | 10.2 |
| 2001 | 7.3 | 6.6 | 7.2 | 7.9 | 7.1 | 13.9 | 9.7 | 10.7 |
| 2002 | 7.4 | 6.7 | 7.3 | 8.2 | 7.2 | 14.1 | 9.7 | 10.2 |
| 2003 | 7.2 | 6.7 | 7.7 | 8.2 | 7.3 | 13.2 | 9.7 | 10.2 |
| 2004 | 7.0 | 6.5 | 7.1 | 8.0 | 7.2 | 12.7 | 9.7 | 9.8 |
| 2005 | 7.1 | 6.6 | 7.2 | 8.2 | 7.3 | 13.0 | 9.9 | 10.3 |
| 2006 | 7.0 | 6.5 | 7.2 | 8.0 | 7.0 | 12.7 | 9.7 | 9.8 |
| 2007 | 7.0 | 6.5 | 7.0 | 8.0 | 6.7 | 12.6 | 9.7 | 9.4 |
| 2008 | 6.9 | 6.4 | 7.0 | 7.7 | 6.7 | 12.7 | 9.3 | 9.1 |
| 2009 | 7.0 | 6.3 | 7.0 | 7.7 | 6.9 | 12.4 | 9.7 | 9.6 |
| 2010 | 6.8 | 6.5 | 7.0 | 7.7 | 6.9 | 12.5 | 9.5 | 9.3 |
| 2011 | 6.9 | 6.6 | 6.9 | 7.8 | 6.8 | 11.7 | 9.3 | 9.3 |
| 2012 | 6.9 | 6.4 | 7.0 | 7.7 | 6.7 | 11.9 | 9.2 | 8.9 |
| 2013 | 6.9 | 6.3 | 6.9 | 7.7 | 6.7 | 11.7 | 9.3 | 9.0 |
| 2014 | 6.7 | 6.3 | 6.9 | 7.9 | 6.5 | 11.7 | 9.3 | 9.0 |
| 2015 | 6.7 | 6.2 | 6.7 | 7.7 | 6.7 | 11.7 | 9.2 | 8.9 |
S&E = science and engineering.
- SOURCE: Doctorate Recipients from U.S. Universities 2015. Related detailed data: tables 31, 32.