
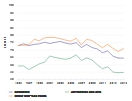
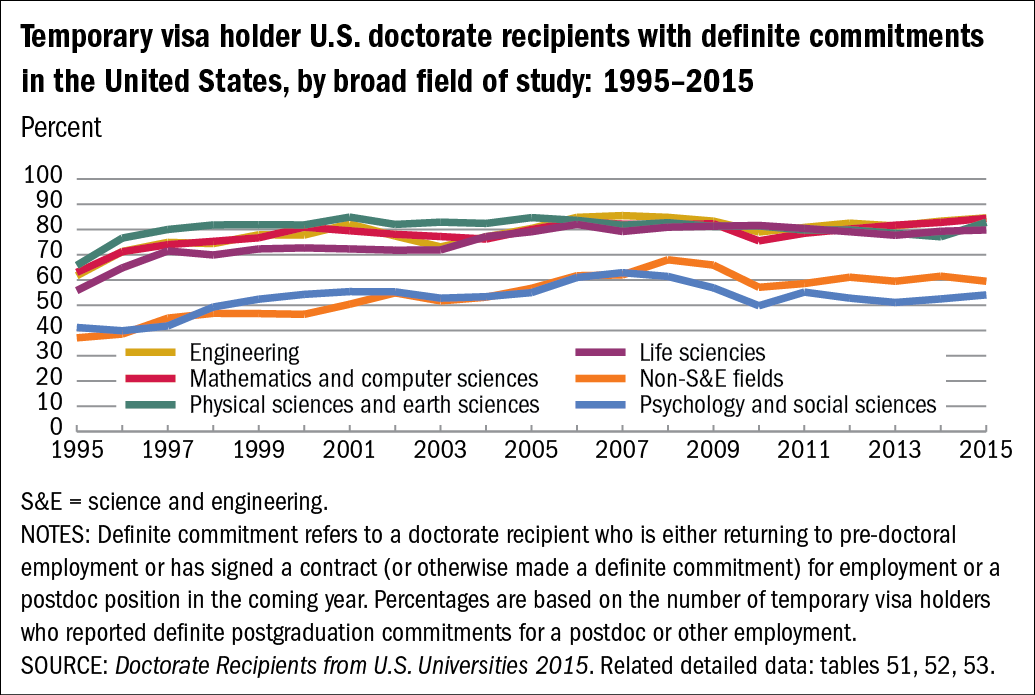
Over the past 20 years, temporary visa holders earning doctorates have been increasingly likely to accept postdoc positions or other employment in the United States immediately following graduation. In 1995, more than half of temporary visa holder doctorate recipients with definite commitments for a postdoc or other employment reported that the location of their postgraduation position was in the United States. By 2015, that proportion had risen to greater than three-fourths. The share of temporary visa holder doctorates whose definite commitments are in the United States is greatest in fields where temporary visa holders are most prevalent: life sciences, physical and earth sciences, mathematics and computer sciences, and engineering (figure F).
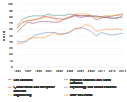
Temporary visa holder U.S. doctorate recipients with definite commitments in the United States, by broad field of study: 1995–2015
| Year | All fields | Life sciences | Physical sciences and earth sciences | Mathematics and computer sciences | Psychology and social sciences | Engineering | Non-S&E fields |
|---|---|---|---|---|---|---|---|
| 1995 | 53.8 | 55.8 | 65.8 | 63.0 | 41.2 | 61.7 | 37.1 |
| 1996 | 61.8 | 64.8 | 76.6 | 71.2 | 39.9 | 71.3 | 38.6 |
| 1997 | 66.8 | 71.5 | 80.0 | 74.0 | 41.8 | 74.9 | 44.9 |
| 1998 | 68.0 | 69.9 | 81.8 | 75.3 | 49.3 | 74.4 | 46.8 |
| 1999 | 69.2 | 72.3 | 81.9 | 76.7 | 52.4 | 77.9 | 46.7 |
| 2000 | 69.6 | 72.7 | 81.8 | 80.9 | 54.3 | 77.8 | 46.4 |
| 2001 | 72.5 | 72.3 | 84.9 | 79.5 | 55.4 | 82.2 | 50.4 |
| 2002 | 70.7 | 71.8 | 82.0 | 78.1 | 55.3 | 77.4 | 54.9 |
| 2003 | 68.4 | 71.9 | 82.9 | 77.2 | 52.8 | 73.1 | 51.7 |
| 2004 | 70.8 | 77.2 | 82.4 | 76.2 | 53.4 | 77.1 | 53.2 |
| 2005 | 73.9 | 79.1 | 84.7 | 80.0 | 55.0 | 80.4 | 56.7 |
| 2006 | 77.7 | 82.0 | 83.6 | 83.1 | 61.0 | 84.8 | 61.7 |
| 2007 | 77.3 | 79.2 | 81.7 | 82.1 | 62.9 | 85.5 | 62.0 |
| 2008 | 78.3 | 80.9 | 82.7 | 81.9 | 61.4 | 84.8 | 68.0 |
| 2009 | 76.9 | 81.3 | 81.2 | 82.3 | 56.9 | 83.3 | 65.9 |
| 2010 | 73.3 | 81.6 | 81.4 | 75.5 | 49.8 | 79.0 | 57.1 |
| 2011 | 74.6 | 80.4 | 79.8 | 78.5 | 55.2 | 80.8 | 58.6 |
| 2012 | 75.0 | 79.1 | 79.8 | 80.2 | 52.8 | 82.5 | 61.1 |
| 2013 | 74.1 | 77.7 | 78.5 | 81.7 | 51.1 | 81.4 | 59.5 |
| 2014 | 75.3 | 79.3 | 77.1 | 82.8 | 52.5 | 83.3 | 61.5 |
| 2015 | 76.9 | 79.8 | 82.8 | 84.4 | 54.1 | 84.6 | 59.5 |
- S&E = science and engineering.
- NOTES: Definite commitment refers to a doctorate recipient who is either returning to pre-doctoral employment or has signed a contract (or otherwise made a definite commitment) for employment or a postdoc position in the coming year. Percentages are based on the number of temporary visa holders who reported definite postgraduation commitments for a postdoc or other employment.
- SOURCE: Doctorate Recipients from U.S. Universities 2015. Related detailed data: tables 51, 52, 53.