
Science and engineering
At any given time, the job market will be better for new doctorate recipients in some fields of study than in others, although all fields tend to follow a similar cyclical pattern that generally reflects overall trends in economic conditions.
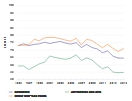
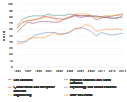
In every broad science and engineering (S&E) field, the proportion of 2015 doctorate recipients who reported definite commitments for employment or postdoctoral (postdoc) study was at or near the lowest level of the past 15 years, and it was 4 to 13 percentage points below the proportion reported in 2006, the most recent high point in definite commitments for S&E fields (figure A).
Definite commitments at doctorate award of U.S. doctorate recipients, by science and engineering field of study: 1995–2015

| Year | All fields | Life sciences | Physical sciences and earth sciences | Mathematics and computer sciences | Psychology and social sciences | Engineering |
|---|---|---|---|---|---|---|
| 1995 | 65.8 | 70.3 | 64.8 | 63.5 | 65.0 | 57.0 |
| 1996 | 67.5 | 70.7 | 68.0 | 66.6 | 65.1 | 63.6 |
| 1997 | 67.4 | 71.1 | 69.8 | 68.9 | 64.2 | 65.3 |
| 1998 | 69.7 | 71.8 | 72.4 | 69.7 | 67.8 | 69.8 |
| 1999 | 69.9 | 72.4 | 73.0 | 72.8 | 67.5 | 67.7 |
| 2000 | 71.2 | 72.4 | 73.6 | 76.0 | 69.8 | 69.9 |
| 2001 | 72.9 | 72.9 | 77.1 | 75.3 | 72.5 | 72.5 |
| 2002 | 72.5 | 73.6 | 76.1 | 76.1 | 72.2 | 69.6 |
| 2003 | 71.3 | 72.1 | 73.5 | 73.8 | 73.2 | 64.6 |
| 2004 | 70.0 | 71.2 | 70.8 | 72.8 | 71.1 | 63.6 |
| 2005 | 70.5 | 70.6 | 71.7 | 74.6 | 73.0 | 64.6 |
| 2006 | 71.6 | 71.7 | 72.0 | 74.2 | 74.1 | 66.0 |
| 2007 | 68.7 | 66.4 | 71.9 | 73.0 | 72.5 | 64.7 |
| 2008 | 69.2 | 65.8 | 71.3 | 70.9 | 72.7 | 65.1 |
| 2009 | 69.5 | 66.8 | 72.1 | 72.1 | 72.9 | 66.8 |
| 2010 | 68.1 | 65.9 | 72.0 | 71.5 | 71.4 | 65.4 |
| 2011 | 65.5 | 62.6 | 69.0 | 69.8 | 69.0 | 64.1 |
| 2012 | 65.9 | 62.8 | 66.9 | 70.2 | 70.1 | 64.0 |
| 2013 | 62.6 | 58.5 | 64.0 | 68.6 | 68.9 | 59.5 |
| 2014 | 61.4 | 58.0 | 61.6 | 66.8 | 68.7 | 57.2 |
| 2015 | 62.0 | 58.6 | 61.1 | 69.8 | 68.5 | 58.2 |
NOTES: Definite commitment refers to a doctorate recipient who is either returning to pre-doctoral employment or has signed a contract (or otherwise made a definite commitment) for employment or a postdoc position in the coming year. Percentages are based on the number of doctorate recipients responding to the postgraduation status item.
- SOURCE: Doctorate Recipients from U.S. Universities 2015. Related detailed data: tables 42, 43.