
Non-science and engineering
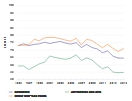
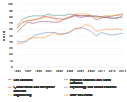
The proportion of doctorate recipients with definite commitments for employment or postdoc study increased between 2014 and 2015 for doctorates in other non-S&E fields, but it changed little for doctorates in education and humanities and arts. The share of doctorate recipients with definite commitments remained at or near the 20-year low points in each of these three non-S&E fields (figure B).
Definite commitments at doctorate award of U.S. doctorate recipients, by non-science and engineering field of study: 1995–2015

| Year | All fields | Education | Humanities and arts | Other non-S&E fields |
|---|---|---|---|---|
| 1995 | 65.8 | 72.9 | 59.1 | 73.1 |
| 1996 | 67.5 | 74.1 | 59.2 | 73.1 |
| 1997 | 67.4 | 72.9 | 56.7 | 73.5 |
| 1998 | 69.7 | 73.7 | 58.6 | 77.1 |
| 1999 | 69.9 | 74.1 | 60.6 | 76.2 |
| 2000 | 71.2 | 75.2 | 61.7 | 78.1 |
| 2001 | 72.9 | 74.3 | 65.9 | 78.5 |
| 2002 | 72.5 | 75.1 | 64.9 | 78.3 |
| 2003 | 71.3 | 75.7 | 64.2 | 77.6 |
| 2004 | 70.0 | 74.6 | 63.6 | 76.6 |
| 2005 | 70.5 | 73.9 | 64.5 | 75.9 |
| 2006 | 71.6 | 74.9 | 66.7 | 77.8 |
| 2007 | 68.7 | 71.6 | 62.8 | 73.4 |
| 2008 | 69.2 | 73.7 | 64.6 | 77.1 |
| 2009 | 69.5 | 71.6 | 63.2 | 76.4 |
| 2010 | 68.1 | 70.7 | 60.1 | 73.8 |
| 2011 | 65.5 | 68.1 | 57.3 | 71.5 |
| 2012 | 65.9 | 69.3 | 58.5 | 73.7 |
| 2013 | 62.6 | 65.8 | 55.0 | 71.1 |
| 2014 | 61.4 | 64.5 | 54.6 | 68.9 |
| 2015 | 62.0 | 64.4 | 54.8 | 70.9 |
S&E = science and engineering.
NOTES: Definite commitment refers to a doctorate recipient who is either returning to pre-doctoral employment or has signed a contract (or otherwise made a definite commitment) for employment or a postdoc position in the coming year. Percentages are based on the number of doctorate recipients responding to the postgraduation status item.
- SOURCE: Doctorate Recipients from U.S. Universities 2015. Related detailed data: tables 42, 43.