
Academic employment
In 2015, nearly half of all doctorate recipients with definite commitments for employment in the United States (excludes those with commitments for postdoc positions) reported that their principal job would be in academe.
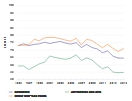
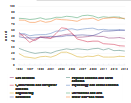
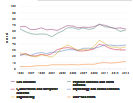
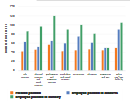
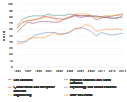
The highest rates of academic employment commitments are reported by doctorate recipients in humanities and arts and other non-S&E fields; the lowest rates are reported in engineering and in physical and earth sciences. Over the past 10 years, the rate of academic employment commitments by doctorate recipients in S&E fields has declined by 8 percentage points, whereas the academic employment rate of doctorates in non-S&E fields has increased by 5 percentage points (figure C).
Definite commitments for academic employment in the United States, by broad field of study: 1995–2015

| Year | All fields | S&E fields | Life sciences | Physical sciences and earth sciences | Mathematics and computer sciences | Psychology and social sciences | Engineering | Non-S&E fields | Humanities and arts | Education | Other non-S&E fields |
|---|---|---|---|---|---|---|---|---|---|---|---|
| 1995 | 52.4 | 42.4 | 51.4 | 28.3 | 55.3 | 53.8 | 19.1 | 62.9 | 79.8 | 48.3 | 76.7 |
| 1996 | 48.8 | 38.1 | 51.8 | 24.8 | 46.8 | 53.4 | 14.1 | 61.1 | 79.2 | 46.4 | 76.5 |
| 1997 | 45.8 | 34.2 | 45.0 | 21.9 | 38.6 | 50.0 | 12.8 | 60.6 | 77.7 | 46.4 | 72.9 |
| 1998 | 45.7 | 33.8 | 41.8 | 19.8 | 43.9 | 51.4 | 11.5 | 61.3 | 78.6 | 46.5 | 72.8 |
| 1999 | 48.8 | 37.1 | 47.5 | 21.1 | 48.1 | 51.9 | 14.1 | 62.7 | 80.7 | 47.2 | 75.7 |
| 2000 | 48.6 | 37.7 | 46.0 | 21.9 | 47.5 | 52.0 | 14.8 | 62.0 | 78.0 | 47.9 | 73.0 |
| 2001 | 48.4 | 36.2 | 45.8 | 20.2 | 45.8 | 54.0 | 13.4 | 63.7 | 79.1 | 49.0 | 74.4 |
| 2002 | 52.3 | 41.6 | 48.7 | 23.7 | 53.8 | 57.9 | 16.5 | 64.7 | 81.6 | 48.4 | 78.7 |
| 2003 | 54.4 | 45.3 | 50.7 | 25.8 | 63.6 | 58.2 | 21.7 | 64.1 | 81.4 | 48.5 | 77.5 |
| 2004 | 56.1 | 46.7 | 52.3 | 27.6 | 62.3 | 60.8 | 22.0 | 65.6 | 83.3 | 50.2 | 77.1 |
| 2005 | 54.3 | 44.7 | 53.2 | 26.2 | 54.6 | 62.0 | 18.5 | 65.6 | 82.5 | 50.2 | 76.2 |
| 2006 | 51.1 | 39.8 | 47.4 | 27.7 | 44.4 | 59.9 | 14.3 | 65.5 | 80.8 | 51.0 | 74.7 |
| 2007 | 51.1 | 39.0 | 47.7 | 26.8 | 42.1 | 61.3 | 13.3 | 66.9 | 84.3 | 51.5 | 78.5 |
| 2008 | 51.1 | 39.6 | 48.6 | 26.0 | 39.7 | 62.4 | 15.1 | 66.4 | 85.1 | 50.8 | 78.9 |
| 2009 | 51.8 | 41.0 | 50.0 | 27.8 | 40.8 | 63.0 | 14.4 | 66.2 | 83.9 | 50.3 | 80.2 |
| 2010 | 52.6 | 41.8 | 48.9 | 28.5 | 40.8 | 60.2 | 16.9 | 67.2 | 80.6 | 53.4 | 76.0 |
| 2011 | 51.8 | 39.1 | 48.7 | 25.8 | 36.4 | 60.9 | 13.6 | 71.4 | 82.5 | 57.9 | 79.6 |
| 2012 | 50.5 | 37.7 | 46.1 | 28.1 | 35.8 | 59.9 | 13.5 | 71.2 | 81.4 | 57.9 | 80.4 |
| 2013 | 50.2 | 37.4 | 46.2 | 24.5 | 35.2 | 60.0 | 13.6 | 72.1 | 82.2 | 58.6 | 81.3 |
| 2014 | 49.2 | 37.0 | 46.9 | 25.0 | 32.9 | 60.1 | 14.9 | 72.2 | 81.8 | 59.4 | 80.0 |
| 2015 | 48.5 | 36.6 | 45.5 | 23.9 | 32.4 | 59.6 | 14.4 | 70.8 | 78.7 | 59.4 | 79.8 |
S&E = science and engineering.
NOTE: Percentages are based on the number of doctorate recipients who reported definite commitments for employment in the coming year (including those missing employer type) and plans to stay in the United States.
- SOURCE: Doctorate Recipients from U.S. Universities 2015. Related detailed data: tables 44, 51, 52.