
Global Competitors Outpace U.S. in Patents
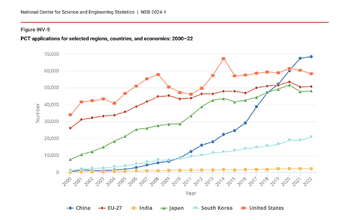
Patent applications for selected regions, countries, and economies: 2000–22 (Credit and Larger Version)
February 29, 2024
China, the United States, the European Union, and Japan lead the number of patent applications filed in their home jurisdictions in 2022; however, the U.S. saw a dip in applications from 2021 to 2022.
These and similar trends are in the Invention, Knowledge Transfer, and Innovation report that the National Science Board published today. The report is part of the 2024 congressionally mandated Science and Engineering Indicators analysis of the state of the U.S. science and engineering enterprise, prepared by the U.S. National Science Foundation’s National Center for Science and Engineering Statistics under the National Science Board’s guidance.
Patent and trademark applications are key indicators for where new inventions, as well as products and processes, are emerging. Patents represent useful ideas and trademarks typically protect products and services. In 2022, the U.S. Patent and Trademark Office awarded 47% of patents (152,000) to domestic inventors while 53% went to foreign inventors. U.S. assigned trademarks grew by 12% between 2012 and 2022 and China assigned trademarks increased by more than 40 times over, from 2,810 to 120,004.
“The United States has led the world for decades in advancing the most fundamental technologies that have fueled the country’s economic growth and stability. The rise in international patents and trademarks demonstrates that U.S. innovation leadership is not a birthright,” said Dario Gil, Chair of the National Science Board’s External Engagement Committee and Senior Vice President and Director of IBM research.
“We must invest deeply in cultivating the best talent for the United States and in developing the next generation of innovators, in being the global leaders for core strategic technologies, such as artificial intelligence, semiconductors, biotech and quantum computing. And we must work collaboratively with our international partners on jointly advancing science and engineering capacity as it relates to solving our biggest challenges related to national security, healthcare, and driving overall economic prosperity,” Gil said.
Patent data also highlight innovation hubs across the U.S. For instance, U.S. patenting and trademark activities are concentrated in certain areas of the country, with the highest rates on the East Coast and West Coast, around the Great Lakes, and in parts of the Southwest.
The report draws information from both direct survey-based measures of innovation output from the businesses and indirect innovation indicators connected to venture investment and trademarks. Self-reported company data on the introduction of new or significantly improved products are reported based on a joint National Center for Science and Engineering Statistics and Census Bureau survey that now contains three consecutive years of data.
Additional highlights:
- Internationally, China and the United States are granted the highest numbers of Artificial Intelligence patents, with China’s AI patents primarily granted in machine learning.
- Approximately 190,000 Artificial Intelligence patents were granted worldwide between 2000 and 2022. In 2022, about 40,000 AI patents were granted to inventors with addresses from China; the comparable figure for the United States was about 9,000.
- Machine learning, personal devices and computing, and computer vision were categories that had the highest number of patents received, based on technology, application, or field. Among the United States, China, Japan, and South Korea, inventors with addresses in China had the highest number of patents in all three categories.
- Patents for climate change mitigation in energy generation, transmission, and distribution account for the highest number of patents in technologies for climate change mitigation and adaptation issued by the Patent and Trademark Office.
- In technologies for environmental sustainability, the state of New Mexico has the highest degree of specialization in patents for renewable energy generation and storage among all states, based on inventor addresses within the U.S.
- The top three counties in 2022 for trademark intensity are Sheridan County in Wyoming, followed by Teton County, also in Wyoming, and then by New York County in New York State.
- Worldwide, venture capital investments ranged between $300 billion and $400 billion between 2018 and 2020. In 2021, however, these investments experienced an unprecedented boom. Global venture investments almost doubled between 2020 and 2021, reaching an all-time high of more than $740 billion. This historic increase in 2021 was followed by a decrease to about $540 billion in 2022, a decline of 27%.
- Datasets released as public use files with the report provides more than twenty consecutive years of patent and trademark data. Patent and Trademark Office data covers country, state, and county patent counts for dozens of technology categories. Trademark data cover county level trademarks for ten categories of products and services.
The Invention, Knowledge Transfer, and Innovation report is the sixth of 10 Science and Engineering Indicators reports that the NSB will publish over the coming months through spring of 2024.
About Science and Engineering Indicators
Science and Engineering Indicators is a congressionally mandated report on the state of the U.S. and international science and engineering enterprise. Indicators provides high-quality quantitative information on the enterprise in a series of reports and a data tool that provides state-level data.
About the NSB
The National Science Foundation Act of 1950 charged the NSB with two roles: to be the governing board of the NSF and an advisor to Congress and the President on policy matters related to STEM research and STEM education. Selected for their distinguished service and accomplishments in academia, government, and the private sector, the Board’s 24 presidentially appointed members are leaders in STEM research and education.
About the NCSES
NSF’s National Center for Science and Engineering Statistics (NCSES) is the nation's leading provider of statistical data on the U.S. science and engineering enterprise. As a principal federal statistical agency, NCSES serves as a clearinghouse for the collection, interpretation, analysis, and dissemination of objective science and engineering data.
Media Contact: Elizabeth Jeffers, National Science Board, (703) 292-7496, ejeffers@nsf.gov
Useful NSB Web Sites:
Home Page: http://www.nsf.gov/nsb
Media Contact: http://www.nsf.gov/staff/staff_bio.jsp?lan=nlymn&org=NSF
News: http://www.nsf.gov/nsb/news
Meetings: http://www.nsf.gov/nsb/meetings
Publications: http://www.nsf.gov/nsb/publications
Facebook: https://www.facebook.com/NationalScienceBoard
Twitter: Twitter: https://twitter.com/intent/user?screen_name=NSF_NSB
YouTube: https://www.youtube.com/channel/UCkrHRzuGSrPp2haQs0T_Pww
To view PDF documents, please download Adobe Acrobat Reader.