America’s share decreasing as global science and engineering grows
New report shows mixed trends for the United States

A piece of the quantum puzzle (Credit and Larger Version)
January 15, 2020
Since the start of the 21st century, other nations, especially in East and Southeast Asia, have heavily invested in science and engineering (S&E) education and grown their research and development (R&D) enterprise as they adopt the American playbook that has brought the U.S. prosperity, underpins our national security, and has transformed our lives. This worldwide increase in S&E activity translates into a decline in the U.S. global shares of R&D investments, high R&D industry output, S&E publications, and other S&E measures.
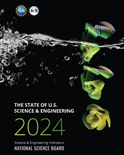
The 2020 State of U.S. Science and Engineering report published today by the National Science Foundation (NSF) and National Science Board (NSB) lays out the data, trends, and global position of the U.S. S&E enterprise. The report is part of the congressionally mandated Science and Engineering Indicators. With the 2020 edition, Indicators is changing from a single report released every two years to a series of streamlined reports published on a rolling basis.
“Our latest report shows the continued spread of S&E capacity across the globe, which is good for humanity because science is not a zero-sum game,” said NSB Chair Diane Souvaine. “However, it also means that where once the U.S. was the uncontested leader in S&E, we now are playing a less dominant role in many areas.”
“Indicators is a treasure trove of data that lets us know how we are doing and how we compare to other nations,” said Arthur Lupia, Assistant Director of the National Science Foundation’s Social, Behavioral, and Economic Sciences directorate. “To better meet the needs of policymakers, industry leaders, and other users, Indicators is now more accessible, more frequent, and more timely.”
Research & Development
In 2017, the U.S. spent more on R&D than any other country – $548 billion. Since 2000, however, the U.S. global share of R&D has declined from 37% to 25%. U.S. spending on R&D grew modestly between 2000 and 2017, averaging 4.3% annually, driven mainly by the business sector. Business has been the largest funder of total R&D in the U.S. since the 1980s (currently 70% of the total). However, the bulk of business R&D is on experimental development. The Federal government’s share of R&D funding has declined since 2000, which is notable because it is an important source of support for the nation’s basic and applied research enterprise. In 2017, the Federal government funded 38% ($76 billion) of U.S. basic and applied research while the business sector accounted for 43% ($85 billion).
“Federal support of basic research drives innovation. Only the Federal government can make a strategic, long-term commitment to creating new knowledge that cannot be anticipated to lead to new or improved technologies, goods, or services,” said Julia Phillips, Chair of NSB’s Science and Engineering Policy Committee. “Basic research is the ‘seed corn’ of our U.S. S&E enterprise, a global competitive advantage, and the starting point for much of our GDP growth since World War II.”
Since 2000, global expenditures in R&D have tripled. R&D expenditures reflect a nation’s commitment to expanding science and technology capabilities that, in turn, drive innovation. Asian countries have heavily contributed to the overall increase in global R&D, with China accounting for nearly a third of the total growth since 2000. And while China is not the only story, its dramatic annual rate of R&D growth has it on a path to soon become the world’s largest R&D performer. Notably, the bulk of China’s R&D spending is in experimental development. Experimental development aims to produce new products or processes or improve existing ones while basic and applied research aims to create new knowledge.
Talent/Human Capital
Demand for people with S&E skills keeps growing. Since 1960, the U.S. S&E workforce has grown faster than the overall workforce. By 2026, S&E jobs are predicted to grow by 13% compared with 7% growth in the overall workforce.
U.S. science and mathematics assessments are a measure of how the country is doing in preparing our population for current and future job demands. Based on test scores, U.S. science and mathematics education at the elementary and secondary level is mediocre and stagnant relative to other countries.
For decades, the U.S. has relied on foreign-born talent to help meet its S&E job needs. A considerable proportion of U.S. S&E degrees – especially at the doctorate level (34%) -- go to international students, many of whom remain in the U.S. after graduating. However, Indicators data show a startling shift: the long-term trend of ever-increasing foreign student enrollment in U.S. colleges and universities has changed as the rate of increase has slowed since 2016. Internationally mobile students still pick the U.S. more than any other country for their higher education degrees. But students today have more choices than ever before as nations actively court globally-mobile talent.
Domestically, the data show increased numbers of women and underrepresented minorities—blacks, Hispanics, and American Indians and Alaska Natives— who hold S&E degrees and are in the S&E workforce. For example, since 1993, the numbers of underrepresented minorities with their highest degree in S&E collectively increased nearly four-fold. The number of women in S&E jobs or who hold a bachelor’s degree or higher in S&E doubled since 1995. However, these increases were outpaced by the rapid growth of S&E jobs so that women and minorities remain underrepresented relative to their proportions in the U.S. population.
“Research is now a truly global enterprise. Opportunities are everywhere and humanity’s collective knowledge is growing exponentially,” said Diane Souvaine. “To remain a leader, we need to tap into our American ‘can do’ spirit and recommit to strong partnerships among government, universities, and industry that have been the hallmarks of our success. I believe we should react with excitement, not fear, because we are well positioned to compete, collaborate, and thrive.”
About Science and Engineering Indicators
Science and Engineering Indicators (https://ncses.nsf.gov/indicators) is a congressionally mandated report on the state of the U.S. science and engineering enterprise. With the 2020 edition, Indicators is changing from a single report released every two years to a set of disaggregated and streamlined reports published on a rolling basis. Indicators is prepared under the guidance of the NSB by the National Center for Science and Engineering Statistics, a federal statistical agency within the National Science Foundation.
About the National Science Board
The Foundation consists of the National Science Board and NSF’s Director. Jointly the Board and the Director pursue the goals and function of the NSF. NSB identifies issues critical to NSF's future and establishes the agency’s policies within the framework of applicable national policies set forth by the President and the Congress. The Board also serves as an independent body of advisors to both the President and the Congress on policy matters related to science and engineering and education in science and engineering. NSB’s 24 members are appointed by the President for six-year terms and selected for their eminence in research, education and records of distinguished service.
Media contact: Nadine Lymn, National Science Board Office, (703) 292-2490, nlymn@nsf.gov
Useful NSB Web Sites:
Home Page: http://www.nsf.gov/nsb
Media Contact: http://www.nsf.gov/staff/staff_bio.jsp?lan=nlymn&org=NSF
News: http://www.nsf.gov/nsb/news
Meetings: http://www.nsf.gov/nsb/meetings
Publications: http://www.nsf.gov/nsb/publications
Facebook: https://www.facebook.com/NationalScienceBoard
Twitter: Twitter: https://twitter.com/intent/user?screen_name=NSF_NSB
YouTube: https://www.youtube.com/channel/UCkrHRzuGSrPp2haQs0T_Pww
To view PDF documents, please download Adobe Acrobat Reader.
