Hispanics
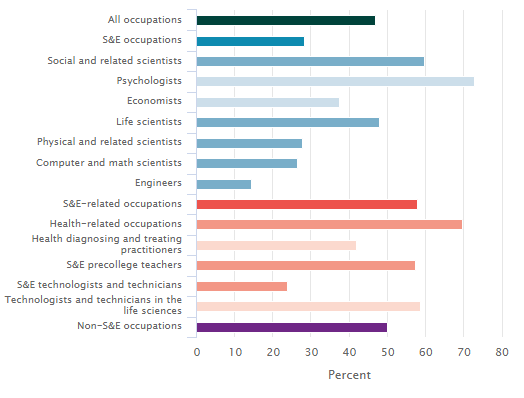
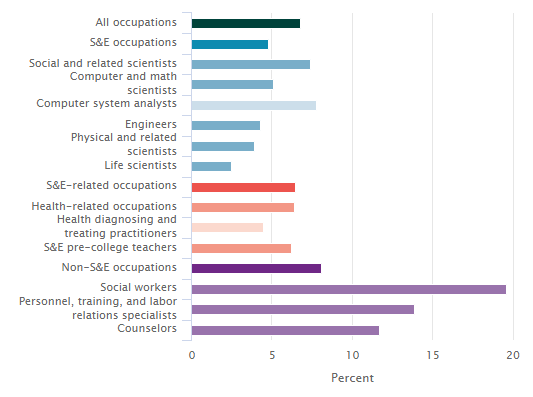
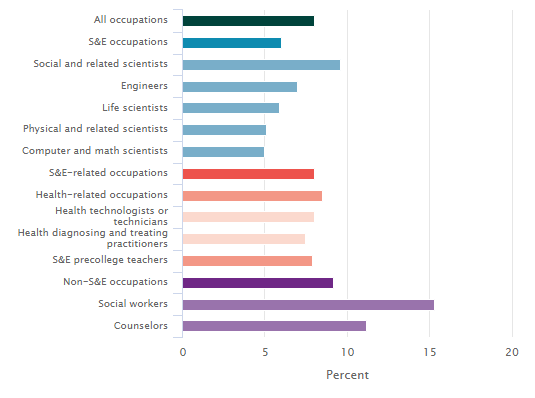
Like blacks, Hispanics make up a smaller proportion of workers in S&E occupations than of the U.S. workforce as a whole (6% versus 16%). Relative to their share of S&E occupations, Hispanic scientists and engineers hold larger shares of S&E-related and non-S&E occupations. Hispanics constitute larger shares of those employed as social workers or health technologists or technicians than they do of computer and math scientists and physical and related scientists.
Employed Hispanic scientists and engineers, as a percentage of selected occupations: 2015
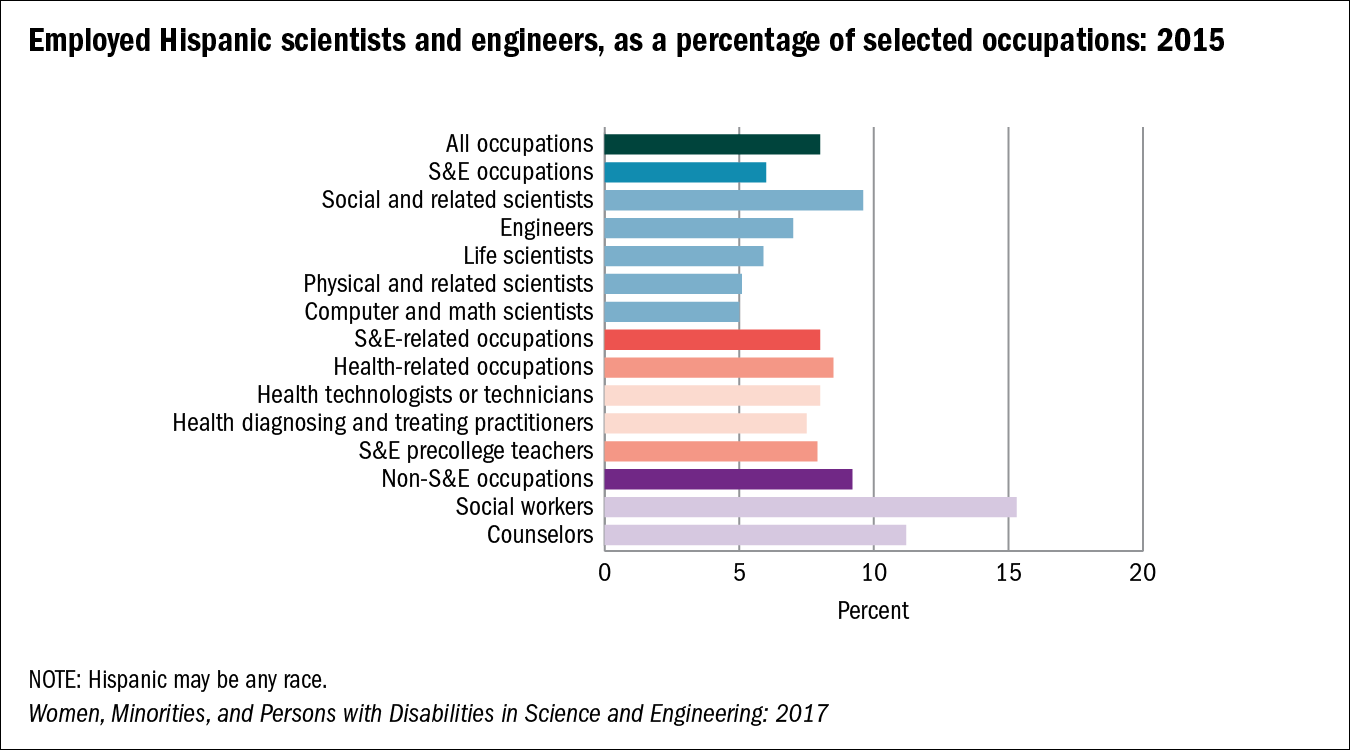
NOTE: Hispanic may be any race.