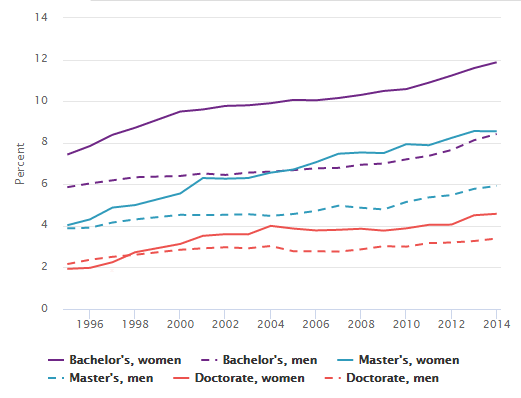
Whites
In contrast to underrepresented minorities, among whites, women earn a lower proportion of S&E degrees than men at all degree levels. The gap is largest at the doctoral level. In 2014, white women earned 19% and white men earned 24% of all S&E doctorates. At all degree levels, white men's share declined steeply from 1995 to 2004, in contrast to white women's share, which declined less steeply at the bachelor's and master's levels and increased slightly at the doctorate level.
Science and engineering degrees earned by white women and men: 1995–2014
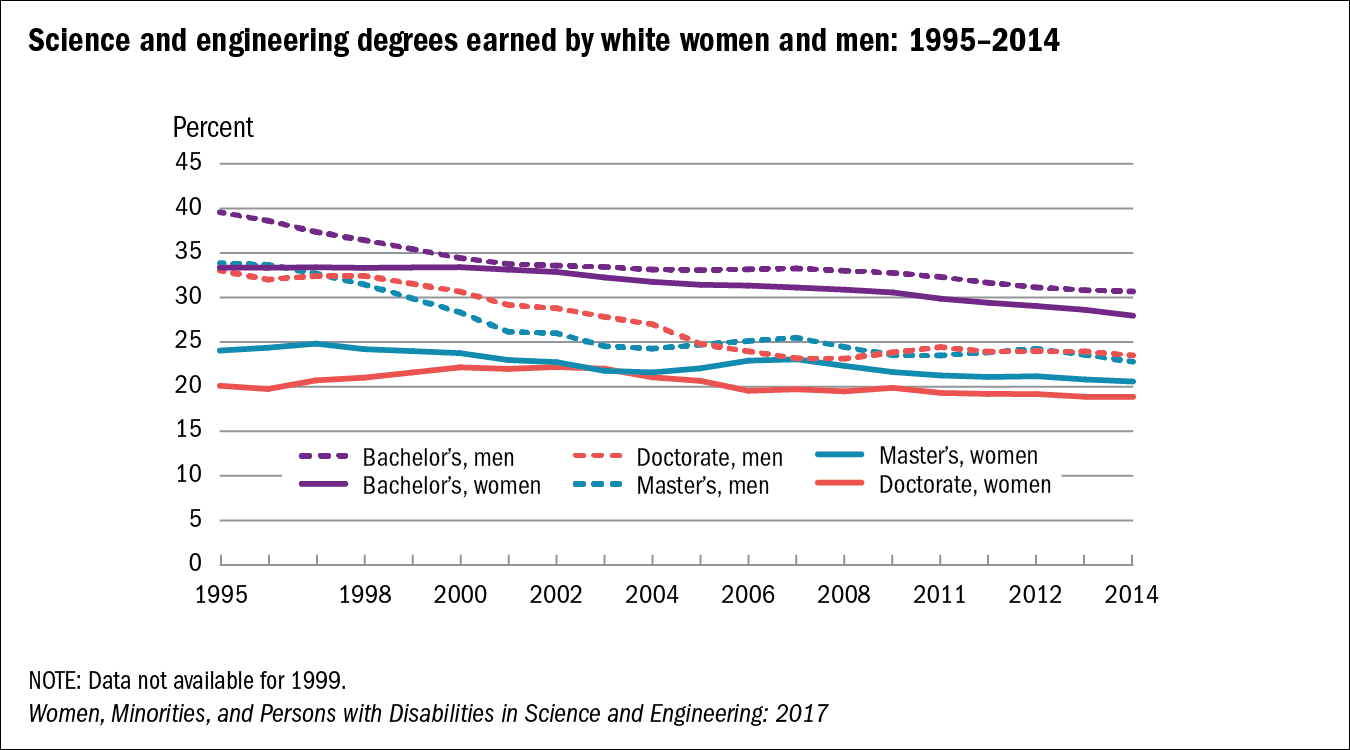
NOTE: Data not available for 1999.