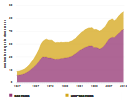


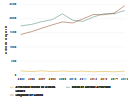
Participation in doctoral education by underrepresented minorities who are U.S. citizens or permanent residents is increasing, as evidenced by a 31% increase in the number of doctorates awarded to blacks or African Americans over the past 10 years and a 71% increase in the number of Hispanic or Latino doctorate recipients. Owing to these growth rates, the proportion of doctorates earned by blacks or African Americans has risen from 6.2% in 2005 to 6.5% in 2015, and the proportion awarded to Hispanics or Latinos has grown from 5.1% to 7.0%. The number of American Indian or Alaska Native doctorate recipients increased from 2014 to 2015 (figure F).
Doctorates earned by underrepresented minority U.S. citizens and permanent residents: 2005–15

| Year | American Indian or Alaska Native | Black or African American | Hispanic or Latino |
|---|---|---|---|
| 2005 | 137 | 1,741 | 1,435 |
| 2006 | 113 | 1,789 | 1,532 |
| 2007 | 140 | 1,891 | 1,655 |
| 2008 | 115 | 1,961 | 1,773 |
| 2009 | 132 | 2,168 | 1,880 |
| 2010 | 117 | 1,939 | 1,843 |
| 2011 | 127 | 1,899 | 1,990 |
| 2012 | 104 | 2,056 | 2,144 |
| 2013 | 119 | 2,172 | 2,135 |
| 2014 | 103 | 2,172 | 2,192 |
| 2015 | 130 | 2,281 | 2,451 |
NOTES: Excludes U.S. citizen and permanent resident respondents who did not report ethnicity or race. Hispanic may be any race.
- SOURCE: Doctorate Recipients from U.S. Universities 2015. Related detailed data: tables 19, 22, 23, 24.