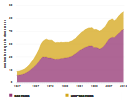


The 55,006 research doctorate degrees awarded by U.S. institutions in 2015 represent the highest number ever reported by the Survey of Earned Doctorates (SED). The number of doctorates awarded over time shows a strong upward trend—average annual growth of 3.3%—punctuated by periods of slow growth and even decline.
In every year of the SED, the number of doctorates awarded in science and engineering (S&E) fields has exceeded the number of non-S&E doctorates, and the gap is widening. From 1975 to 2015, the number of S&E doctorate recipients has more than doubled, reflecting an average annual growth rate of 1.9%, whereas the number of non-S&E doctorates awarded in 2015 is virtually identical to the 1975 count. As a result of these different growth rates, the proportion of S&E doctorates climbed from 58% in 1975 to 75% in 2015 (figure A).
Doctorates awarded by U.S. colleges and universities: 1957–2015

| Year | S&E fields | Non-S&E fields |
|---|---|---|
| 1957 | 5,638 | 2,973 |
| 1958 | 5,751 | 3,022 |
| 1959 | 6,043 | 3,170 |
| 1960 | 6,388 | 3,345 |
| 1961 | 6,872 | 3,541 |
| 1962 | 7,612 | 3,888 |
| 1963 | 8,422 | 4,306 |
| 1964 | 9,462 | 4,863 |
| 1965 | 10,706 | 5,634 |
| 1966 | 11,732 | 6,217 |
| 1967 | 13,274 | 7,129 |
| 1968 | 14,824 | 8,113 |
| 1969 | 16,574 | 9,169 |
| 1970 | 18,458 | 11,040 |
| 1971 | 19,869 | 11,998 |
| 1972 | 19,752 | 13,289 |
| 1973 | 19,808 | 13,947 |
| 1974 | 19,137 | 13,910 |
| 1975 | 19,210 | 13,742 |
| 1976 | 18,821 | 14,125 |
| 1977 | 18,298 | 13,418 |
| 1978 | 17,952 | 12,923 |
| 1979 | 18,213 | 13,025 |
| 1980 | 18,169 | 12,850 |
| 1981 | 18,713 | 12,642 |
| 1982 | 18,736 | 12,372 |
| 1983 | 19,117 | 12,163 |
| 1984 | 19,285 | 12,049 |
| 1985 | 19,504 | 11,791 |
| 1986 | 20,064 | 11,833 |
| 1987 | 20,558 | 11,807 |
| 1988 | 21,675 | 11,822 |
| 1989 | 22,565 | 11,760 |
| 1990 | 23,689 | 12,376 |
| 1991 | 24,894 | 12,636 |
| 1992 | 25,616 | 13,270 |
| 1993 | 26,449 | 13,351 |
| 1994 | 27,304 | 13,730 |
| 1995 | 27,663 | 14,084 |
| 1996 | 28,405 | 14,032 |
| 1997 | 28,486 | 14,053 |
| 1998 | 28,592 | 14,045 |
| 1999 | 27,147 | 13,953 |
| 2000 | 27,378 | 13,991 |
| 2001 | 26,896 | 13,848 |
| 2002 | 26,088 | 13,943 |
| 2003 | 26,714 | 14,049 |
| 2004 | 27,794 | 14,328 |
| 2005 | 29,578 | 13,807 |
| 2006 | 31,584 | 14,037 |
| 2007 | 33,758 | 14,374 |
| 2008 | 34,718 | 14,059 |
| 2009 | 35,314 | 14,239 |
| 2010 | 34,998 | 13,033 |
| 2011 | 36,334 | 12,580 |
| 2012 | 37,852 | 13,099 |
| 2013 | 39,034 | 13,673 |
| 2014 | 40,644 | 13,359 |
| 2015 | 41,261 | 13,745 |
S&E = science and engineering.
- SOURCE: Doctorate Recipients from U.S. Universities 2015. Related detailed data: table 1.