
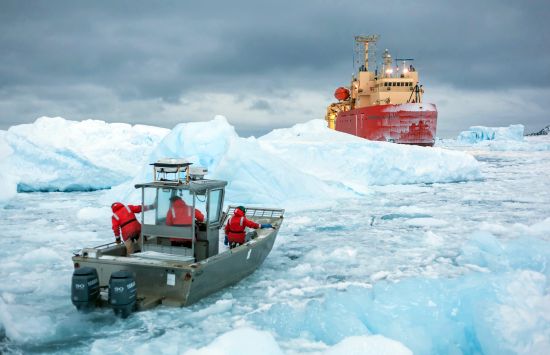
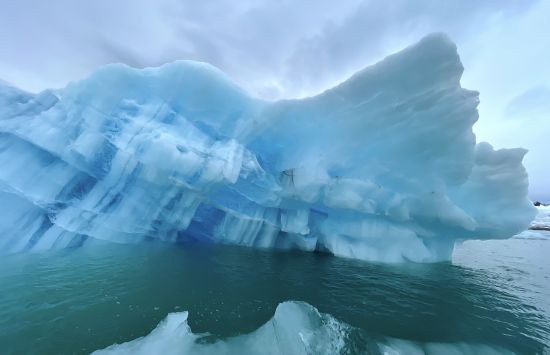
Arctic and Antarctic
Exploring the planet's vulnerable polar regions.

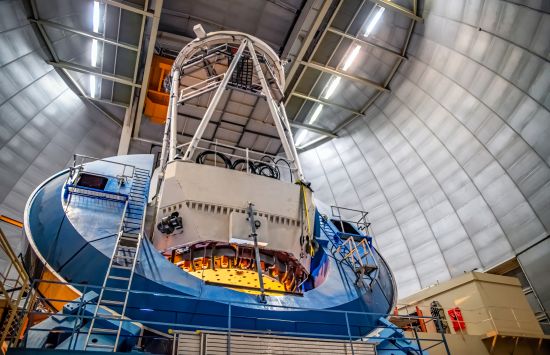
Astronomy and Space
Opening windows to the universe.

Biology
Understanding life in all its forms and sustaining the Earth's ecosystems as they face unprecedented global challenges.
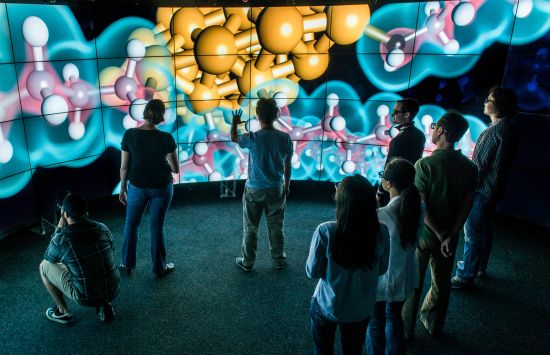
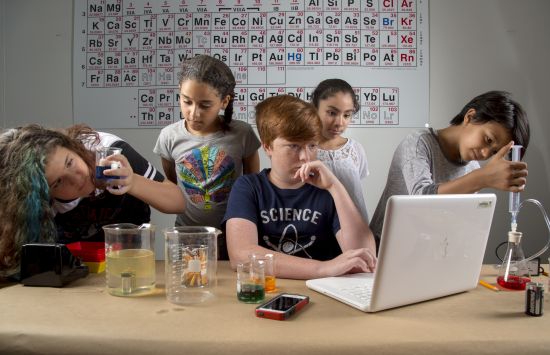
Chemistry
Understanding the basic properties of matter and forging the chemicals of the future.
Computing
Advancing computer and information science and engineering for societal impact.
Creating a STEM Workforce
Inspiring talent and creating opportunities in science and engineering across the nation.
Earth and Environment
Exploring the wonders of our planet to preserve its future.
Education and Training
Unleashing the nation's science and engineering talent.

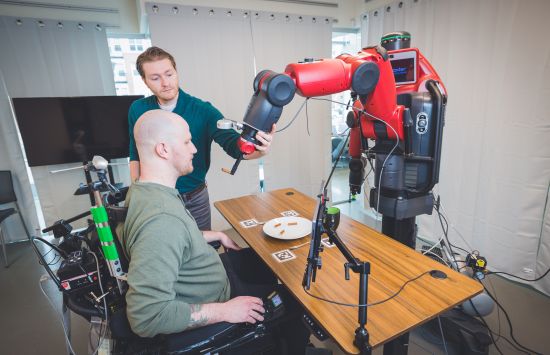
Engineering
Pursuing use-inspired research and innovation to create a future where people can thrive.
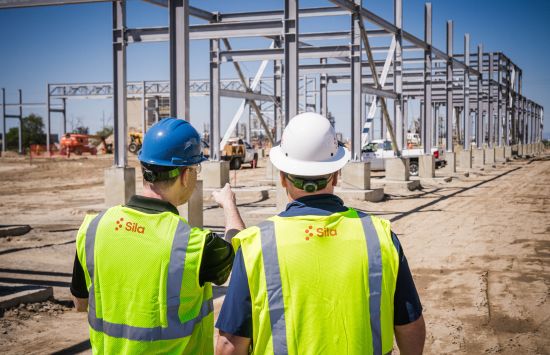
Facilities and Infrastructure
Empowering scientists, engineers and educators to explore, experiment and discover new frontiers.

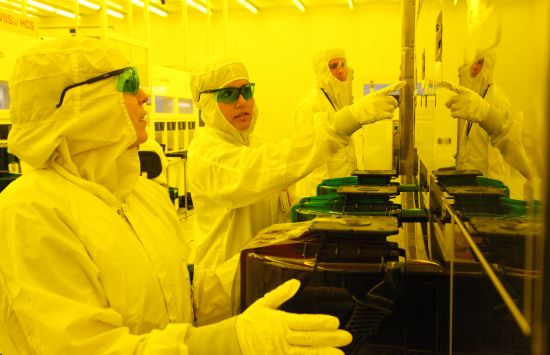
Materials Research
Discovering new materials and processing methods that can unlock innovations across a wide range of sectors.

Mathematics
Developing and exploring the language of the universe.
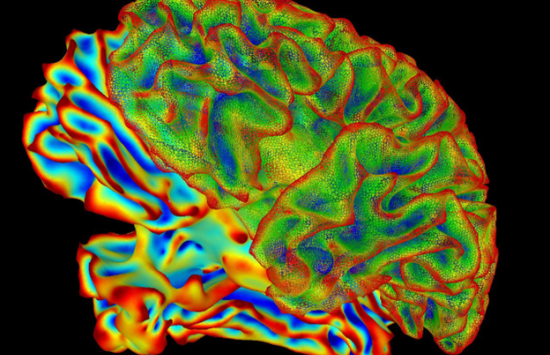
People and Society
Illuminating what makes us human.
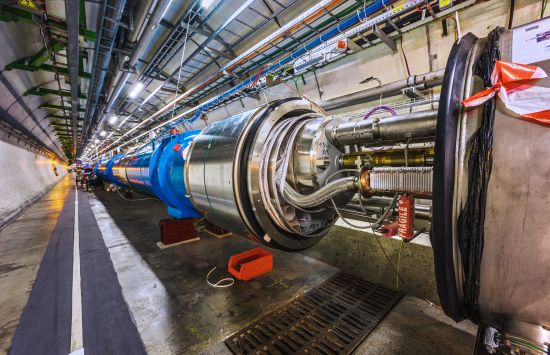
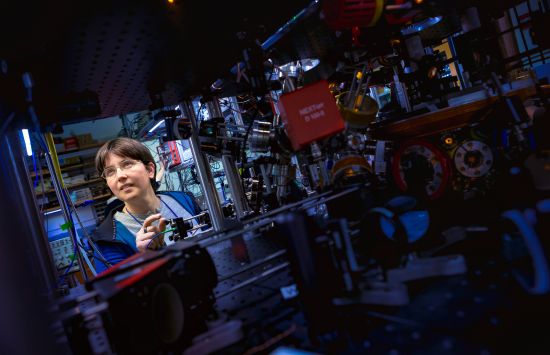
Physics
Understanding the fundamental workings of the universe — from tiny quantum particles to the largest galaxies.
Research Partnerships
Addressing challenges that require collaboration and fresh perspectives.

Interdisciplinary, Convergence and Transformative Research
Research approaches that address societal problems and create new frontiers in science and engineering.