All Images
News Release 17-010
NCSES publishes latest Women, Minorities, and Persons with Disabilities in Science and Engineering report
Report from NCSES, a division of NSF, provides data on the U.S. science and engineering enterprise
This material is available primarily for archival purposes. Telephone numbers or other contact information may be out of date; please see current contact information at media contacts.

The report is part of NSF's congressionally mandated mission to broaden participation in science and engineering.
Credit: wavebreakmedia/Shutterstock.com
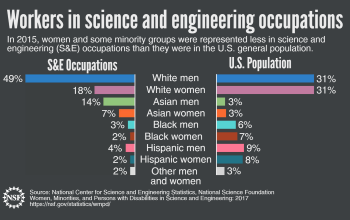
In 2015, women and some minority groups were represented less in science and engineering (S&E) occupations than they were in the U.S. general population.
Credit: NSF
Download the high-resolution PNG version of the image. (180.1 KB)
Use your mouse to right-click (Mac users may need to Ctrl-click) the link above and choose the option that will save the file or target to your computer.
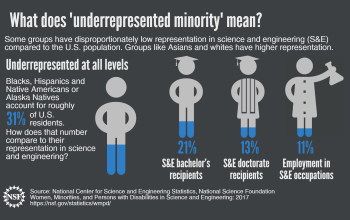
Some groups have disproportionately low representation in science and engineering (S&E) compared to the U.S. population. Groups like Asians and whites have higher representation.
Credit: NSF
Download the high-resolution PNG version of the image. (198.4 KB)
Use your mouse to right-click (Mac users may need to Ctrl-click) the link above and choose the option that will save the file or target to your computer.
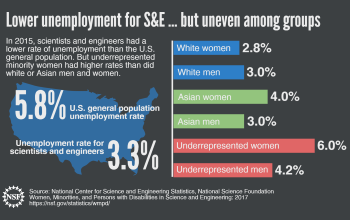
In 2015, scientists and engineers had a lower rate of unemployment than the U.S. general population. But underrepresented minority women had higher rates than did white or Asian men and women.
Credit: NSF
Download the high-resolution PNG version of the image. (216.1 KB)
Use your mouse to right-click (Mac users may need to Ctrl-click) the link above and choose the option that will save the file or target to your computer.
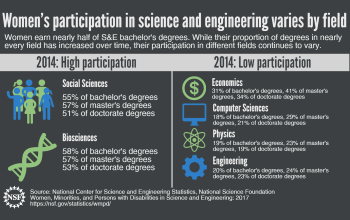
Women earn nearly half of S&E bachelor's degrees. While their proportion of degrees in nearly every field has increased over time, their participation in different fields continues to vary.
Credit: NSF
Download the high-resolution PNG version of the image. (233.1 KB)
Use your mouse to right-click (Mac users may need to Ctrl-click) the link above and choose the option that will save the file or target to your computer.
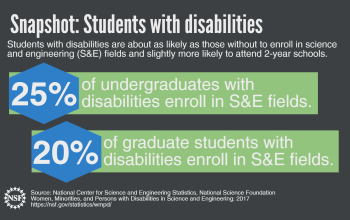
Students with disabilities are about as likely as those without to enroll in science and engineering (S&E) fields and slightly more likely to attend 2-year schools.
Credit: NSF
Download the high-resolution PNG version of the image. (187.2 KB)
Use your mouse to right-click (Mac users may need to Ctrl-click) the link above and choose the option that will save the file or target to your computer.
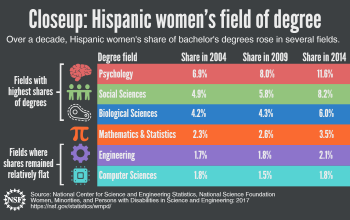
Over a decade, Hispanic women's share of bachelor's degrees rose in several fields.
Credit: NSF
Download the high-resolution PNG version of the image. (203.0 KB)
Use your mouse to right-click (Mac users may need to Ctrl-click) the link above and choose the option that will save the file or target to your computer.
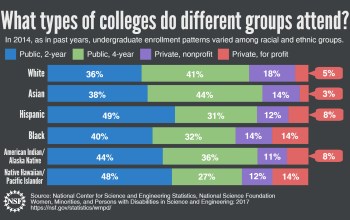
In 2014, as in past years, undergraduate enrollment patterns varied among racial and ethnic groups.
Credit: NSF
Download the high-resolution PNG version of the image. (180.0 KB)
Use your mouse to right-click (Mac users may need to Ctrl-click) the link above and choose the option that will save the file or target to your computer.


