All Images
News Release 11-100
After Japan Nuclear Power Plant Disaster: How Much Radioactivity in the Oceans?
National Science Foundation awards rapid-response grants to establish ocean radionuclide levels from Fukushima
This material is available primarily for archival purposes. Telephone numbers or other contact information may be out of date; please see current contact information at media contacts.

Radiation level in the oceans in 1990, mostly from nuclear weapons testing, measured in Becquerels.
Credit: Woods Hole Oceanographic Institution
Download the high-resolution JPG version of the image. (66 KB)
Use your mouse to right-click (Mac users may need to Ctrl-click) the link above and choose the option that will save the file or target to your computer.

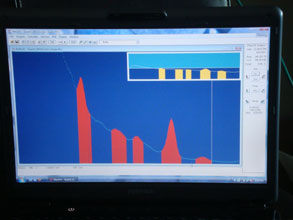
Gamma-spectrum of a 20-liter seawater sample from Guam collected on April 11, 2011.
Credit: Henrieta Dulaiova, University of Hawaii
Download the high-resolution JPG version of the image. (137 KB)
Use your mouse to right-click (Mac users may need to Ctrl-click) the link above and choose the option that will save the file or target to your computer.

Hundreds of liters of seawater are sampled for radioactivity from the central Pacific Ocean.
Credit: Henrieta Dulaiova, University of Hawaii
Download the high-resolution JPG version of the image. (213 KB)
Use your mouse to right-click (Mac users may need to Ctrl-click) the link above and choose the option that will save the file or target to your computer.

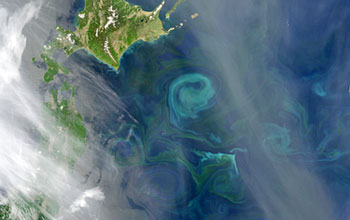
Satellite image from 160 kilometers (100 miles) north of the Fukushima nuclear power plant in Japan. Japan's two large ocean currents--the Kuroshio and the Oyashio--converge here.
Credit: NASA
Download the high-resolution JPG version of the image. (106 KB)
Use your mouse to right-click (Mac users may need to Ctrl-click) the link above and choose the option that will save the file or target to your computer.

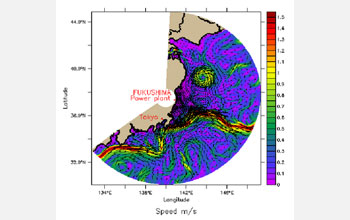
A single frame from an animation showing the path of ocean currents off Japan.
Credit: SIROCCO coastal ocean modeling program
Download the high-resolution JPG version of the image. (165 KB)
Use your mouse to right-click (Mac users may need to Ctrl-click) the link above and choose the option that will save the file or target to your computer.

Human sources of radiation in the atmosphere, compared with natural radionuclides in the ocean.
Credit: Jack Cook, Woods Hole Oceanographic Institution
Download the high-resolution JPG version of the image. (58 KB)
Use your mouse to right-click (Mac users may need to Ctrl-click) the link above and choose the option that will save the file or target to your computer.


