 An official website of the United States government
Chapter 1 | Elementary and Secondary Mathematics and Science Education
Student Learning in Mathematics and Science
Increasing academic achievement for all students—with an emphasis on improving the performance of low-achieving students—is a critical goal of education reform in the United States. It is equally important to increase the number and diversity of students achieving at the highest academic levels. Many educators and policymakers focus on improving student learning in STEM subjects because workers’ proficiency in STEM fields is considered vital to the health of the economy (Atkinson and Mayo 2010; PCAST 2012). This section presents indicators of U.S. students’ performance in STEM subjects in elementary and secondary school. It begins with a review of national trends in scores on mathematics and science assessments, using data from NAEP. Next, it presents data from ECLS-K:2011, which focused on students’ growth from kindergarten to third grade. The section ends by placing U.S. student performance in an international context, comparing the mathematics and science literacy of U.S. 15-year-olds and the mathematics and science performance of U.S. fourth, eighth, and twelfth graders with those of their peers in other countries.
National Trends in K–12 Student Achievement
This subsection looks at trends in U.S. students’ achievement in mathematics and science over time, presenting estimates from NAEP, the largest nationally representative and continuing assessment of what America’s students know and can do in various subject areas. Contributing to this review are 2015 data from the main NAEP mathematics and science assessments of students in grades 4, 8, and 12. All NAEP assessments include students from public and private schools, so results are representative of the in-school population in the United States. Comparable NAEP data are available beginning in 1990 for mathematics for grades 4 and 8 and beginning in 2005 for grade 12. Comparable science data are available since 2009 for all three grades. NAEP 2015 includes the first science achievement data collected for fourth and twelfth graders in 6 years and for eighth graders in 4 years. The section also provides information about student performance in technology and engineering, based on results from a new NAEP assessment, technology and engineering literacy (TEL), which was first administered to eighth graders in 2014. TEL will be administered to students in grades 4 and 12 in future years.
Reporting Results for the Main NAEP
The main NAEP reports student performance in two ways: scale scores and student achievement levels. A scaled score is the total number of correct questions (raw score) on an exam that have been converted onto a consistent and standardized scale. This standardization allows scores reported from a test to have consistent meaning for all test takers, especially across different editions of the same test. Main NAEP scale scores range from 0 to 500 for grades 4 and 8 and from 0 to 300 for grade 12 on the mathematics assessment. On the science and TEL assessments, however, the scale scores range from 0 to 300 for all students. With broad input from the public, educators, and policymakers, the National Assessment Governing Board (NAGB), an independent board that sets policy for NAEP, has developed achievement levels that indicate the extent of students’ achievement expected for a particular grade level. There has been some debate that these levels may be too rigorous; thus, results should be interpreted with caution (Loveless 2016). The three grade-specific achievement levels for mathematics, science, and technology/engineering literacy are the following:
Basic: partial mastery of knowledge and skills
Proficient: solid academic performance
Advanced: superior academic performance
Mathematics Performance of Students in Grades 4, 8, and 12 in 2015
Average score. The average NAEP mathematics score in 2015 was 240 for fourth graders, 282 for eighth graders, and 152 for twelfth graders (Appendix Table 1-1). These scores represent a slight decline from 2013, when the scores were 242, 285, and 153, respectively. These are the first declines in NAEP mathematics assessments since 1990 for fourth and eighth graders and since 2005 for twelfth graders, although these are small changes and may be a natural fluctuation rather than the start of a downward trend. Although the scale is 0 to 500 for the fourth and eighth grade assessments and 0 to 300 for the twelfth grade, it is important to note that the effective score range (i.e., the range from the 10th to the 90th percentiles) for the preponderance of students is less than 100 points, which puts the magnitude of score differences in context. Eighty percent of fourth graders scored between 202 and 277, 80% of eighth graders scored between 235 and 329, and 80% of twelfth graders scored between 107 and 196. Although the long-term trend in average scores for fourth and eighth graders has been upward, the improvement slowed down this past decade. From 2005 to 2015, average NAEP mathematics scores increased by 2 points for fourth graders and 3 points for eighth graders; in comparison, from 1996 to 2005, the average scores increased by 14 points for fourth graders and 9 points for eighth graders (Figure 1-1).
Average NAEP mathematics scores of students in grades 4 and 8: 1990–2015
NAEP = National Assessment of Educational Progress.
Note(s)
NAEP mathematics assessment scores range from 0 to 500 for grades 4 and 8.
Source(s)
National Science Foundation, National Center for Science and Engineering Statistics, special tabulations (2016) of NAEP 1990, 1992, 1996, 2000, 2003, 2005, 2007, 2009, 2011, 2013, and 2015 mathematics assessments, National Center for Education Statistics. See Appendix Table 1-1.
Science and Engineering Indicators 2018
Socioeconomic status. NAEP uses eligibility for the National School Lunch Program (NSLP) as an indicator for SES, with eligibility for the program considered an indicator of SES. It is widely understood that eligibility for the NSLP is an inadequate measure of student poverty or SES for a variety of reasons (Cowan et al. 2012; Snyder and Musu-Gillette 2015). For example, students above the federal poverty level may still qualify for the NSLP, and a comprehensive measure of a student’s SES would include such factors as parental education and occupation in addition to measures of poverty. NAGB and others continue to report school lunch eligibility as a proxy for SES because it is the only measure that is available at the school level. Information on family income, parental education, parental occupation, and other factors needed to better capture SES are not readily available. NAGB is pursuing other ways to report SES for students taking NAEP exams. In the meantime, readers should interpret SES results reported here with the understanding that eligibility for school lunch is not a precise measure of the construct.
Average 2015 NAEP mathematics assessment scores varied by school lunch eligibility for all grade levels, with eligible students posting average scores from 23 to 28 points lower than non-eligible students (Appendix Table 1-1). In the past decade, the gap between eligible and non-eligible students did not decrease in size at any grade level.
Race or ethnicity. Scores also varied by race or ethnicity at all grade levels, with Asian or Pacific Islander students receiving the highest average scores at all three grade levels (Appendix Table 1-1). In 2015, for example, average mathematics scores for eighth graders were 306 for Asian or Pacific Islander students, 292 for white students, 270 for Hispanic students, and 260 for black students. It is important to note that these are average scores, however, and that students from all groups score at the higher and lower ends of the score distributions. Fourth and eighth grade Hispanic and black students reduced gaps relative to white students between 2005 and 2015. Although the average score for white students in grade 4 increased by 2 points after 2005, the average score rose by 4 points for Hispanic students and by 4 points for black students. Similarly, in grade 8, scores improved by 8 and 5 points for Hispanic and black students, respectively, compared with a 3-point gain for white students.
Sex. The average mathematics scores for male fourth graders and twelfth graders were slightly higher than the average scores for female students in those grades: 241 for male versus 239 for female fourth graders, and 153 for male versus 150 for female twelfth graders. There was no difference in scores by sex for eighth graders because female students at this grade level gained more points (4 since 2005) in the past decade than male students did (2 since 2005).
Socioeconomic status and sex by race or ethnicity. Score differences between students who were eligible for free or reduced-price lunch (low SES) and those who were not eligible (high SES) were observed within racial or ethnic groups in 2015. For example, the gaps between eligible and non-eligible students in grade 4 were 25 points among Asian or Pacific Islander students, 18 points among white students, 17 points among Hispanic students, and 16 points among black students (Table 1-2). Similar gaps held among eighth and twelfth grade students, except for a smaller 9-point gap among Hispanic students in grade 12.
A few small differences in average mathematics scores by sex were observed in 2015 within racial or ethnic groups (Table 1-2). In grade 4, the average score for white male students was 2 points higher than the score for white female students. Among black students in grade 4, the pattern was reversed, with the average score for black female students 2 points higher than the score for black male students. The average score for black female students was also higher than that for black male students in grade 8, although there was no significant difference by sex at grade 12. The largest difference in average scores for male and female students was among Hispanic students in grade 12. The average score for male students was 5 points higher than that for female students.
Average scores of students in grades 4, 8, and 12 on the main NAEP mathematics assessment, by socioeconomic status and sex within race or ethnicity: 2015
Proficiency level. Forty percent of fourth graders, 33% of eighth graders, and 25% of twelfth graders achieved a level of proficient or higher in mathematics in 2015 (Appendix Table 1-2). As with average scale scores, these percentages represent slight decreases compared with 2013 for fourth and eighth graders but are slight increases since 2005. In the decade since 2005, the percentage of students scoring proficient or above increased by about 4 percentage points for fourth graders and 3 percentage points for eighth graders. In the period between 1996 and 2005, the increases were larger: about 15 percentage points for students in grade 4, and 7 percentage points for students in grade 8. Although the percentage of students reaching proficiency or better did increase, on average, it stayed well below 50% for all grade levels and decreased as the grade level increased.
Demographic patterns similar to those noted in the discussion of scale scores also characterized the proficiency levels. For example, 51% of grade 4 white and 62% of grade 4 Asian or Pacific Islander students reached proficiency in mathematics (Appendix Table 1-2). The percentages for grade 4 students in other racial or ethnic groups were much lower: 26% for Hispanic students, 23% for American Indian or Alaska Native students, and 19% for black students.
Science Performance of Students in Grades 4, 8, and 12 in 2015
Average score. The average NAEP science scores of students in 2015 were 154 for fourth and eighth graders and 150 for twelfth graders (Appendix Table 1-3). Although the overall scale for the assessments is 0 to 300, the effective score range of these tests is about 90 points: 80% of fourth graders scored between 108 and 196, 80% of eighth graders scored between 109 and 195, and 80% of twelfth graders scored between 103 and 196. The average NAEP science scores increased 4 points between 2009 and 2015 in grades 4 and 8 but did not change for grade 12.
Socioeconomic status. Students who were not eligible for free or reduced-price lunch (high SES) performed better than eligible (low SES) students at all grade levels (Appendix Table 1-3). For example, the gap between non-eligible and eligible fourth graders in 2015 was 29 points. Among eighth graders, the gap was 27 points, and twelfth graders had a gap of 26 points. The gap between non-eligible and eligible students did not decrease significantly between 2009 and 2015 for any grade level.
Race or ethnicity. As with mathematics, average science scores varied by race or ethnicity at all grade levels, with Asian or Pacific Islander and white students scoring 10–16 points above the average score, and black, Hispanic, and American Indian or Alaska Native students scoring 14–25 points below (Appendix Table 1-3). The gaps between the scores of white and black students and between those of white and Hispanic students have narrowed slightly since 2009 in grades 4 and 8 but not in grade 12.
Sex. There were no sex differences in average science scores for students in grade 4 in 2015 (Appendix Table 1-3). However, average scores for male students were higher than scores for female students by 3 points in grade 8 and by 5 points in grade 12. The gap between male and female students in grade 8 narrowed slightly from 5 points in 2011 to 3 points in 2015. The gap in science scores in grade 12 has not narrowed significantly since 2009.
Socioeconomic status and sex by race or ethnicity. There were substantial differences by SES within all racial or ethnic groups and at all grade levels (Table 1-3). For example, gaps between twelfth graders who were eligible for free or reduced-price lunch and those who were not eligible ranged from 13 points for Hispanic students to 27 points for Asian or Pacific Islander students. Average science scores showed some variation by sex within racial or ethnic groups, although, in many cases, differences between male and female students were not significant. The largest difference was among Hispanics in grades 8 and 12, with male students earning higher average scores than female students by 5 points in grade 8 and 7 points in grade 12.
Proficiency level. In 2015, 38% of fourth graders, 34% of eighth graders, and 22% of twelfth graders achieved a level of proficient or higher on the NAEP science assessment (Appendix Table 1-4). The percentage of fourth and eighth grade students scoring at or above the proficient level increased by 4 points since 2009. The percentage of twelfth graders scoring at or above the proficient level did not change significantly during that same period.
Average scores of students in grades 4, 8, and 12 on the main NAEP science assessment, by socioeconomic status and sex within race or ethnicity: 2015
Technology and Engineering Performance of Students in Grade 8 in 2014
The NAEP TEL assessment is the newest addition to NAEP assessment tests. It was first administered in winter 2014 to a nationally representative sample of eighth graders. Rather than testing students for their ability to “do” engineering or produce technology, TEL was designed to gauge how well students can apply their understanding of technology principles to real-life situations. TEL departs from the typical NAEP assessment design because it is completely computer based and includes interactive scenario-based tasks―an innovative component of NAEP (see sidebar About the NAEP Technology and Engineering Literacy Assessment).
The average TEL score was set to 150 out of 300 as a baseline for future comparisons, and 43% of test takers scored at or above the proficient level (Appendix Table 1-5).
Socioeconomic status. Scores on the TEL varied considerably by school lunch eligibility, with the average score for eligible students nearly 30 points below that of non-eligible students. The percentage of non-eligible students scoring at or above the proficient level (59%) was more than double the percentage of eligible students scoring at that level (25%).
Race or ethnicity. The average scores for Asian or Pacific Islander (159) and white (160) students were higher than the average scores for Hispanic (138) and black (128) students. More than half of Asian or Pacific Islander and white students scored at or above the proficient level, compared with 28% of Hispanic students and 18% of black students.
Sex. Female students had an average score of 151, which was slightly higher than male students’ average score of 149. A slightly higher percentage of female than male students scored at or above the proficient level (45% versus 42%).
Socioeconomic status and sex by race or ethnicity. Some sex and school-lunch eligibility differences in TEL achievement were observed within racial or ethnic groups (Table 1-4). Within each racial or ethnic group, students who were eligible for free or reduced-price lunch had average scores at least 19 points lower than non-eligible students. The average score for white female students was slightly higher than the average for white male students, and the same held true for black female and male students.
Average scores of students in grade 8 on the main NAEP technology and engineering literacy assessment, by socioeconomic status and sex within race or ethnicity: 2014
State-Level Performance in Mathematics and Science in 2015
In addition to reporting NAEP achievement at the national level, NAEP also reports achievement at the state level. The NAEP sample in each state is designed to be representative of the students in that state, and results can be compared across states. At the state level, results are reported for public school students only and are broken down by several demographic groupings. In this chapter, we present 2015 NAEP state-level data (average scores and percentages reaching proficient or above) broken out by sex and race or ethnicity for fourth and eighth graders in mathematics and science (Appendix Table 1-6 through Appendix Table 1-13). The Science and Engineering Indicators State Indicators data tool provides NAEP performance and proficiency data for all students in each state—not broken out by sex, race, or ethnicity.
Mathematics and Science Knowledge in Early Childhood
ECLS-K:2011 is a nationally representative, longitudinal study of children’s development, early learning, and school progress (Mulligan, Hastedt, and McCarroll 2012). Data for the ECLS-K:2011 study were first collected in fall 2010 from approximately 18,200 kindergarten students. ECLS-K:2011 has followed and tested the same student sample each year through spring 2016, when most students were in fifth grade. This section provides information about mathematics and science achievement for children in the ECLS-K:2011 cohort who were in kindergarten for the first time in the 2010–11 school year and in the third grade by the spring of 2014. It compares students’ mathematics scores from the beginning of kindergarten to the end of third grade and students’ science scores from the beginning of first grade to the end of third grade. Science was not assessed in kindergarten. Results are reported as scale scores and are used here for comparative purposes rather than as indicators of student progress in meeting grade-level objectives. Students’ mathematics and science assessment results cannot be compared with each other because scales are developed independently for each subject. The possible range of scores for the third grade mathematics assessment in spring 2014 was 0–135, with an actual range of scores of 39–133 and an overall average score of 99 (Table 1-5; Appendix Table 1-14). The possible range of scores for the third grade science assessment in spring 2014 was 0–87, with an actual range of scores of 21–78 and an overall average score of 56 (Appendix Table 1-15).
Average mathematics and science assessment test scores of children who were in kindergarten for the first time during the 2010–11 school year and in third grade during the 2013–14 school year, by child and family characteristics
Socioeconomic status. In spring of third grade, the average score for students in families with income at or above 200% of the federal poverty level was 10 points higher on the mathematics assessment and 8 points higher on the science assessment than for students in families with income below the federal poverty level.
Race or ethnicity. Asian students achieved an average score of 104 on the mathematics assessment at the end of third grade, followed by white (103), Hispanic (94), and black (90) students (Table 1-5). Science assessment scores followed a similar pattern, except that white students (59) earned a slightly higher average score than Asian students (58). In mathematics, black students (26) and Hispanic students (25) earned similar average scores when entering kindergarten, but this pattern reversed by third grade, with Hispanic students earning higher average scores than black students (94 versus 90, respectively). A similar pattern was seen in science.
Sex. ECLS-K:2011 data revealed achievement gaps between male and female students (see sidebar Early Gender Gaps in Mathematics and Teachers’ Perceptions). Although they began kindergarten with the same average scale score in mathematics (29), the average score for male students was higher than for female students by the end of third grade (101 versus 97) (Table 1-5). Science scores showed a similar pattern, with male and female students posting the same average score in first grade (24) and male students slightly outscoring female students by the end of third grade (56 versus 55).
Achievement gap over time. The ECLS-K:2011 mathematics and science results show that students from different racial, ethnic, and socioeconomic groups enter school with different levels of preparation and that those differences persist as they move to higher grades, a finding that is supported in the research literature (Loeb and Bassok 2007; Magnuson and Duncan 2006). For example, the gap in mathematics assessment scores between white and black students was 6 points at the beginning of kindergarten and 13 points in the spring of third grade (Table 1-5). Similarly, the gap in science assessment scores between white and black students was 5 points at the beginning of first grade and 9 points in the spring of third grade. The mathematics score gap between students in families with income below the federal poverty level and those in families with income at or above 200% of the federal poverty level was 9 points at the beginning of kindergarten and 10 points by the spring of third grade (Figure 1-2); the science score gap was 5 points at the beginning of first grade and 8 points by the spring of third grade.
Average mathematics assessment test scores of children who were in kindergarten for the first time during the 2010–11 school year and in the third grade during the 2013–14 school year, by family income level
Note(s)
The mathematics assessment scale was 0 to 75 in kindergarten, 0 to 96 in first grade, 0 to 113 in second grade, and 0 to 135 in third grade. Mathematics was assessed in the fall and spring of each school year with the exception of third grade when students were assessed only in the spring. Poverty status is based on 2010 U.S. Census poverty thresholds, which identify incomes determined to meet household needs, given family size. For example, in 2010, a family of two was below the poverty threshold if its income was lower than $14,220.
Source(s)
Mulligan GM, Hastedt S, McCarroll JC, First-Time Kindergartners in 2010–11: First Findings From the Kindergarten Rounds of the Early Childhood Longitudinal Study, Kindergarten Class of 2010–11 (ECLS-K:2011), NCES 2012-049 (2012); Mulligan GM, McCarroll JC, Flanagan KD, Potter D, Findings From the First-Grade Rounds of the Early Childhood Longitudinal Study, Kindergarten Class of 2010–11 (ECLS-K:2011), NCES 2015-109 (2014); Mulligan GM, McCarroll JC, Flanagan KD, Potter D, Findings From the Second-Grade Rounds of the Early Childhood Longitudinal Study, Kindergarten Class of 2010–11 (ECLS-K:2011), NCES 2015-077 (2015); and Mulligan GM, McCarroll JC, Flanagan KD, Potter D, Findings From the Third-Grade Round of the Early Childhood Longitudinal Study, Kindergarten Class of 2010–11 (ECLS-K:2011), NCES 2016-094 (2016).
Science and Engineering Indicators 2018
International Comparisons of Mathematics and Science Performance
Two international assessments—the Trends in International Mathematics and Science Study (TIMSS) and the Program for International Student Assessment (PISA)—compare U.S. students’ achievement in mathematics and science with that of students in other countries. TIMSS and PISA give different impressions of the United States’ standing relative to other countries, with TIMSS results placing the United States in a higher relative position compared with PISA. This disparity can be traced, in part, to differences in the design and purpose of the assessments. TIMSS focuses on academic content, whereas PISA is designed to measure students’ ability to apply their mathematics and science knowledge to real-world situations. The two tests also vary in other fundamental ways, including age of the students tested and number of participating nations, making direct comparisons difficult. TIMSS and PISA have sampling requirements to ensure that student populations are similar across countries and report when countries do not meet these guidelines. TIMSS and PISA samples include students from public and private schools in the United States. This section presents an overview of each assessment, examines long-term trends in performance on both assessments, and provides a detailed look at the latest data from 2015.
The Trends in International Mathematics and Science Study
TIMSS includes two assessments: TIMSS for students in grades 4 and 8 and TIMSS Advanced for students in their final year of high school. First conducted in 1995, TIMSS assesses the mathematics and science performance of fourth and eighth graders every 4 years. Since its inception, TIMSS has been administered six times, most recently in 2015, when 20,000 fourth and eighth grade students in approximately 500 schools across the United States participated (Provasnik et al. 2016). TIMSS Advanced was administered in 1995, 2008, and 2015. It is designed to assess the advanced mathematics and physics achievement of students in their final year of high school who are taking or have taken advanced courses. The United States participated in the 1995 and 2015 administrations.
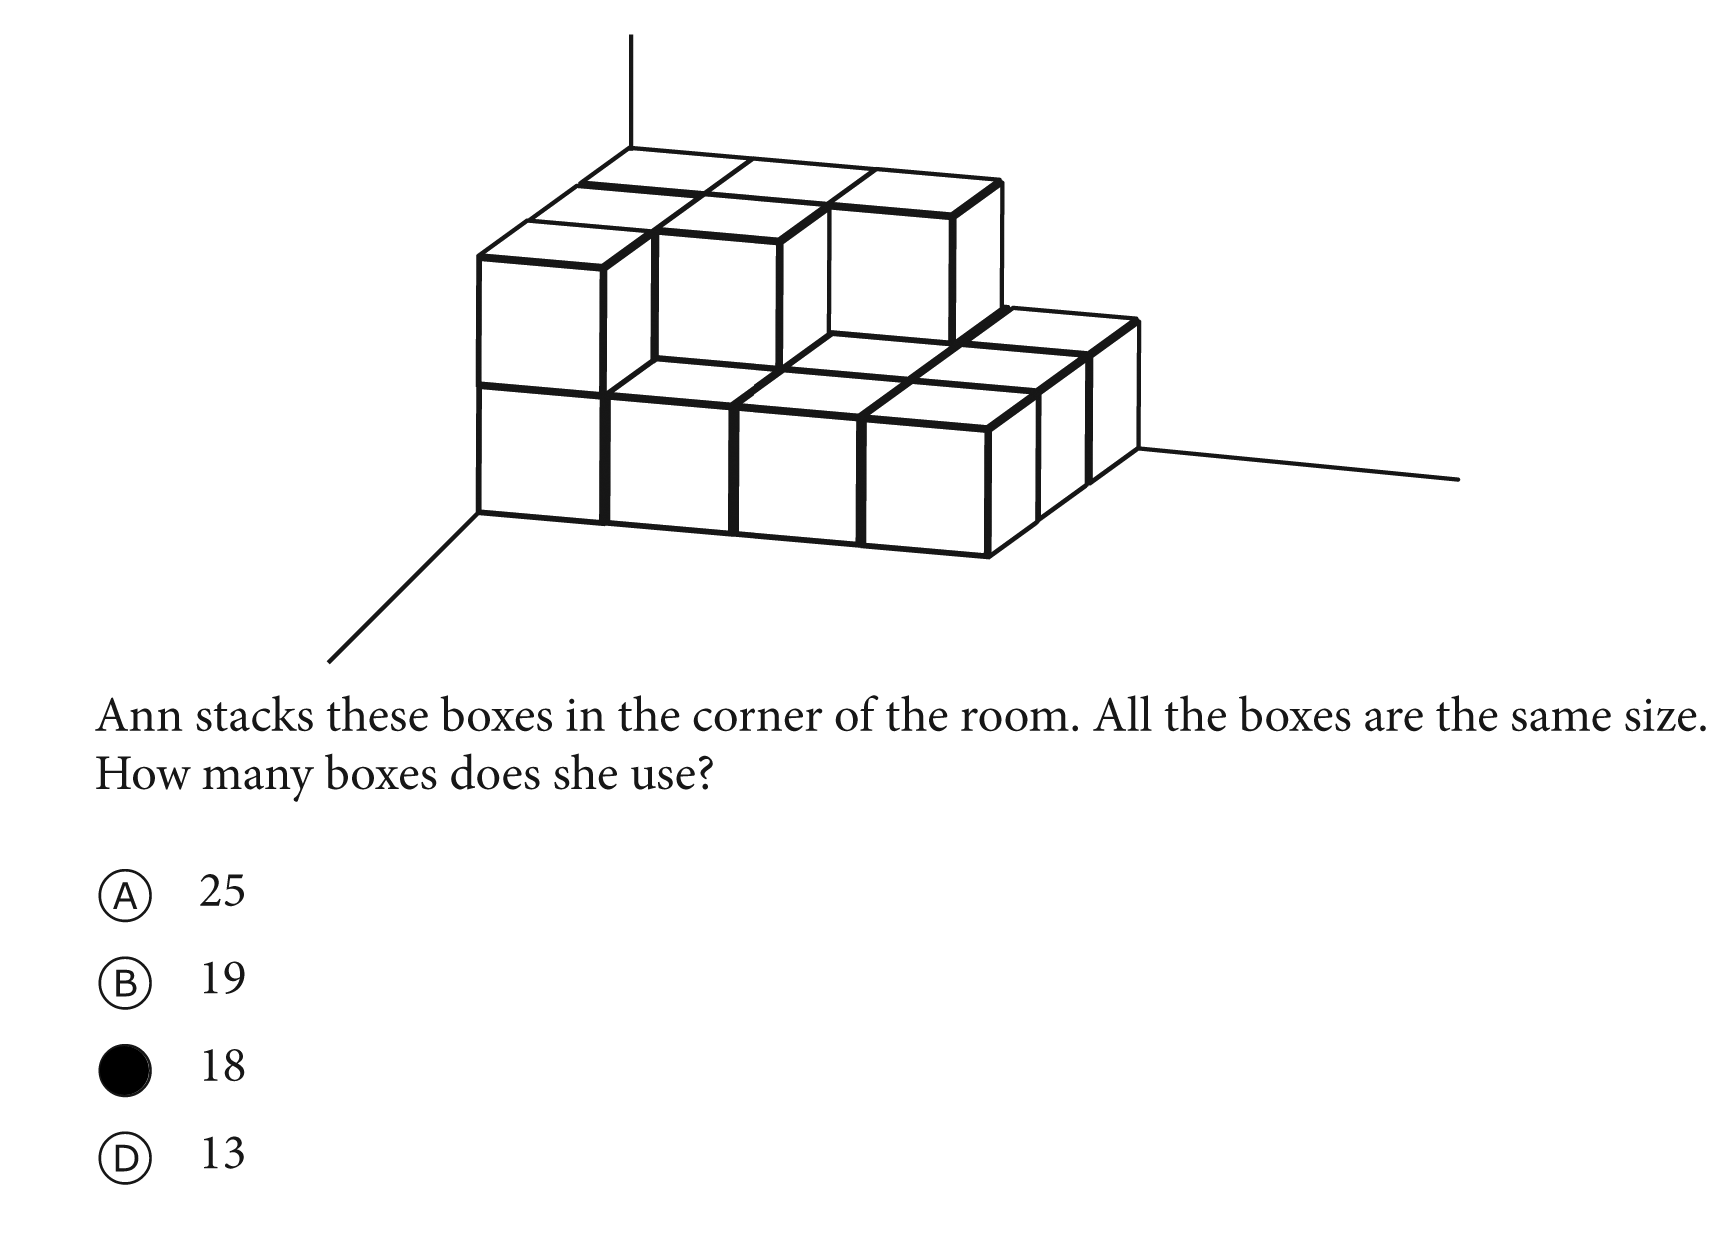
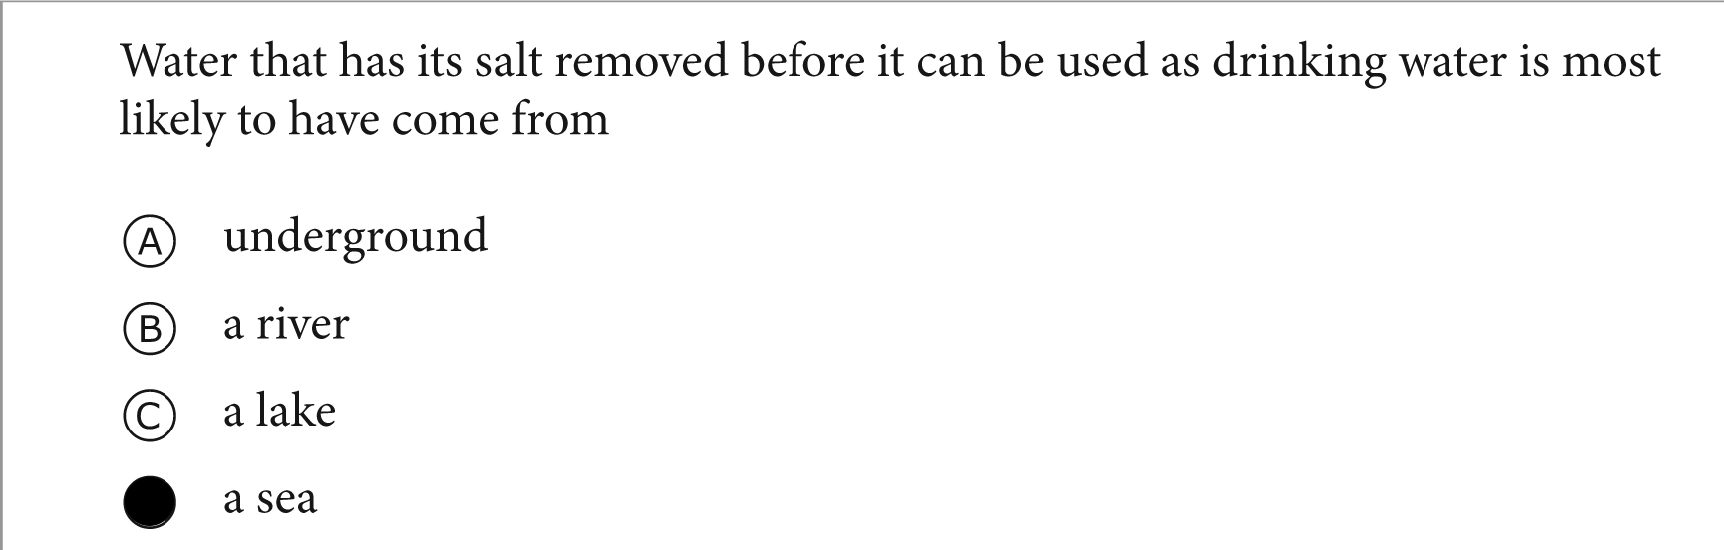
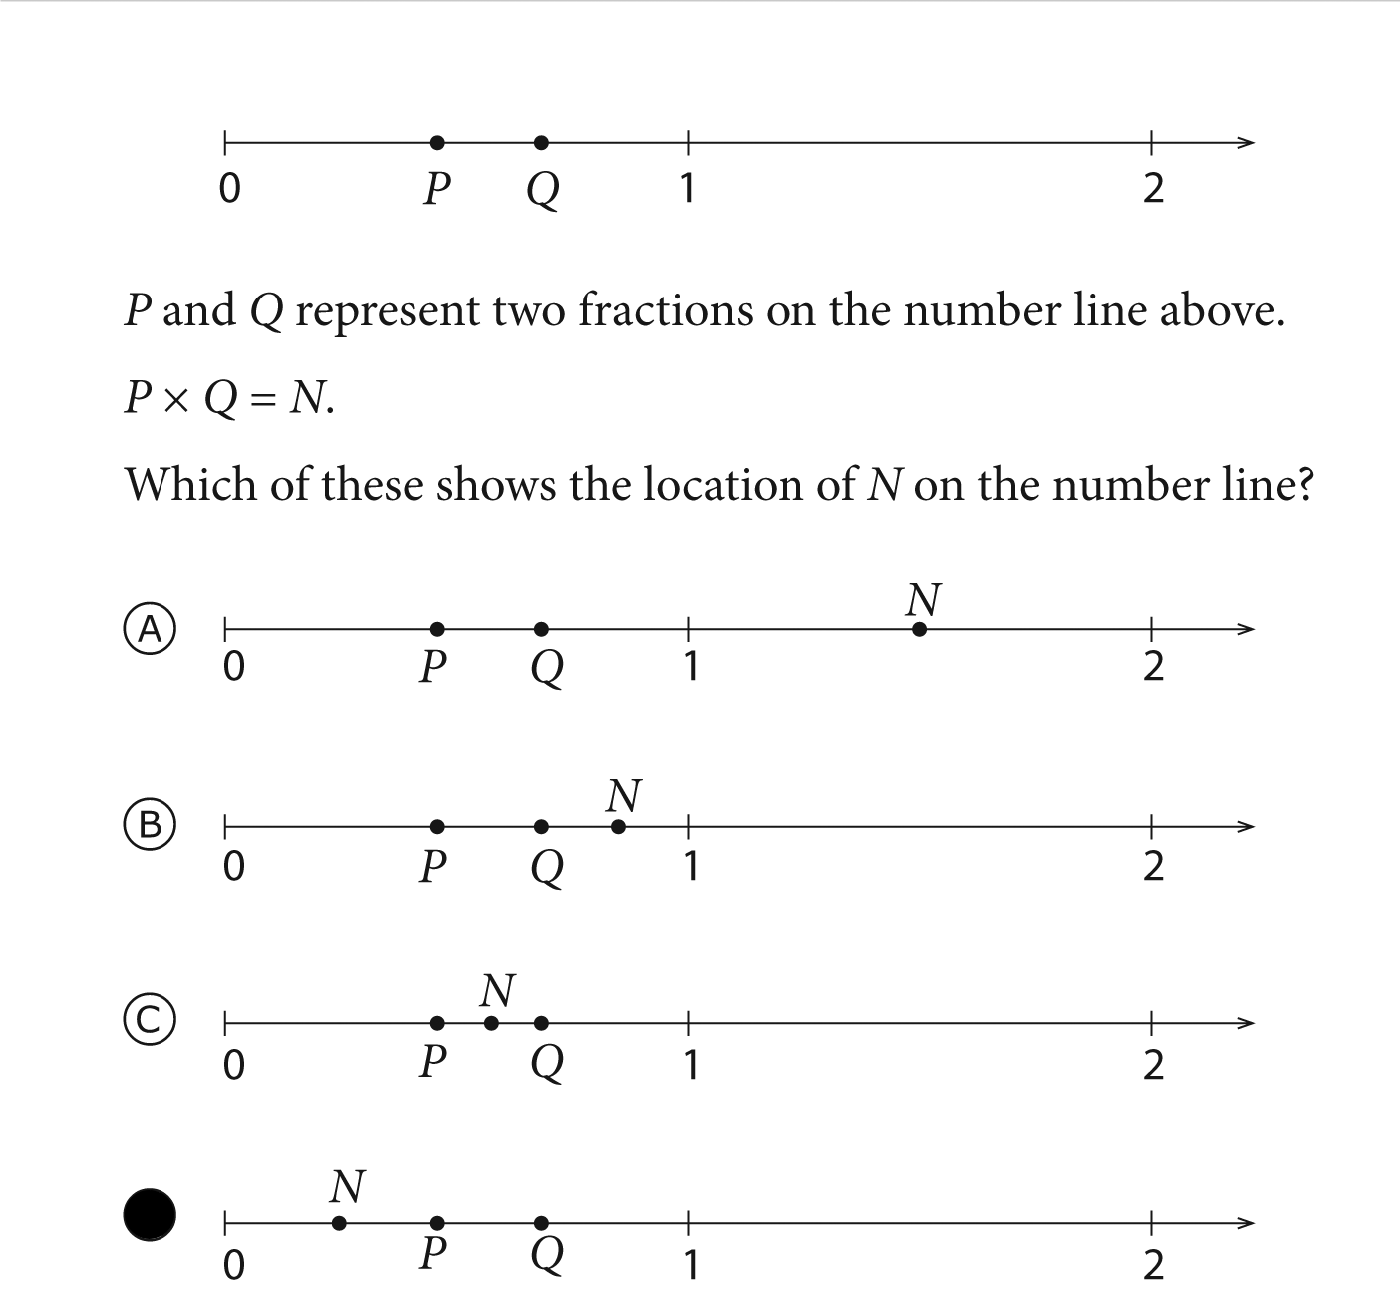
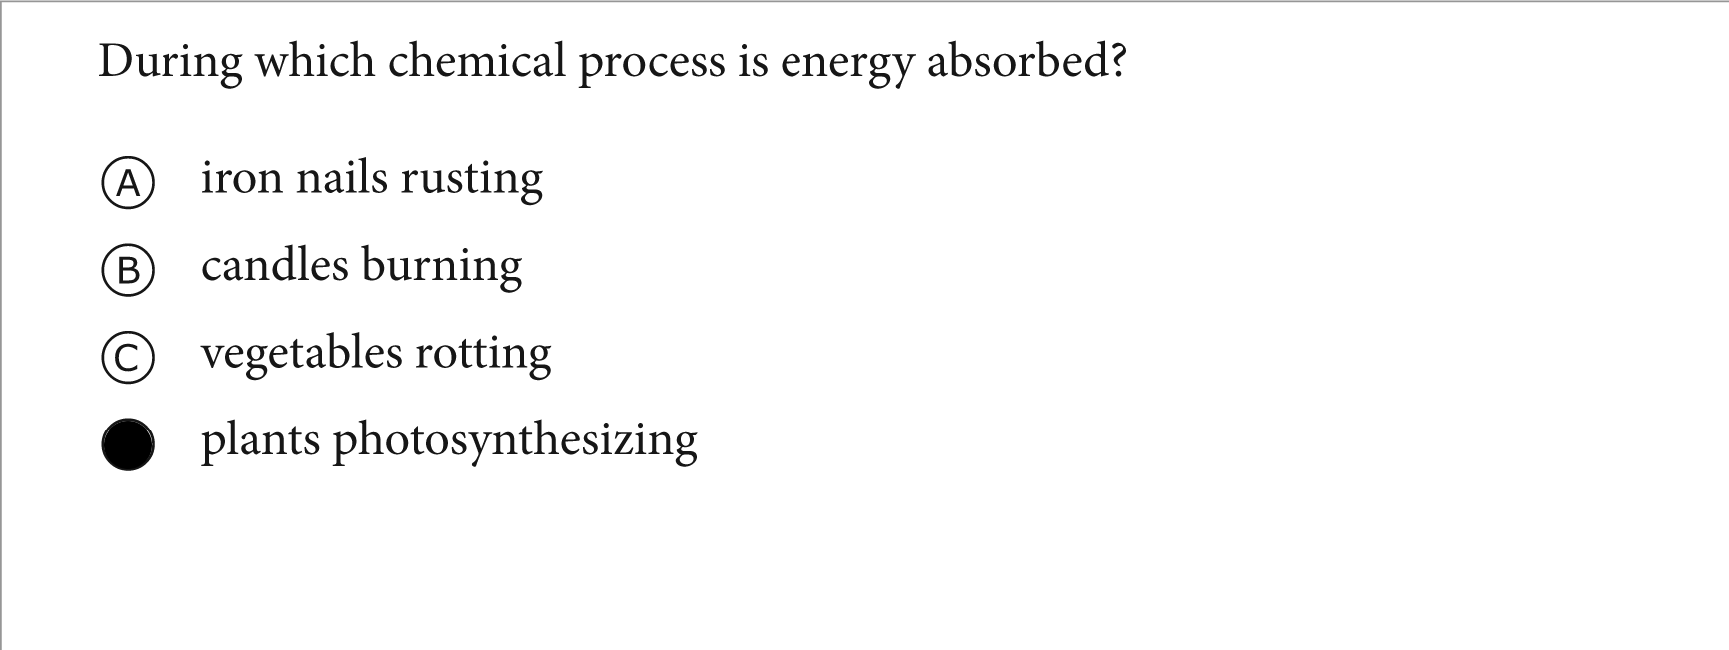
TIMSS and TIMSS Advanced measure students’ knowledge and skills in mathematics and science and their ability to apply their knowledge in problem-solving situations. Both are designed to align broadly with mathematics and science curricula in the participating education systems and, therefore, to reflect students’ school-based learning. At each grade, students respond to multiple-choice and constructed-response items (or questions) designed to measure what they know and can do across specific content domains in mathematics and science (see sidebar Sample Items from the Trends in International Mathematics and Science Study 2015).
Sample Items from the Trends in International Mathematics and Science Study 2015
The examples shown below and other mathematics and science sample questions are available at https://timssandpirls.bc.edu/timss2015/downloads/T15_FW_AppB.pdf and https://timssandpirls.bc.edu/timss2015/downloads/T15_FW_AppC.pdf, respectively.
Sample for Grade 4 Mathematics
Sample for Grade 4 Science
Sample for Grade 8 Mathematics
Sample for Grade 8 Science
TIMSS and TIMSS Advanced are both sponsored by the International Association for the Evaluation of Educational Achievement (IEA), an international, nonprofit organization consisting of research institutions and government research agencies from member countries and economies. In 2015, 48 IEA member countries or economies and 6 benchmarking participants took part in the grade 4 assessment, and 37 IEA member countries and 6 benchmarking participants took part in the grade 8 assessment. Nine education systems—all IEA member countries—participated in TIMSS Advanced 2015. IEA member countries include “countries,” which are complete, independent political entities, and non-national entities (e.g., England, Hong Kong, or the Flemish community of Belgium). The term education systems is used in the analysis here in recognition of the fact that not all TIMSS participants are countries, and this fact should be kept in mind when comparing the performance of the United States and that of other education systems.
Mathematics Performance of U.S. Students in Grades 4 and 8 on TIMSS
Performance on the 2015 TIMSS mathematics tests. The U.S. average score on the 2015 TIMSS mathematics assessment was 539 for grade 4 and 518 for grade 8 (Table 1-6). Although the scale is 0–1,000 for both grades, the effective score range of these tests for the preponderance of American students is about 200 points. Eighty percent of fourth graders scored between 432 and 640; for grade 8, it was between 408 and 624. Among the 48 education systems that participated in the 2015 TIMSS mathematics assessment at grade 4, the U.S. average mathematics score was among the top 18 (10 scored higher; 7 did not differ), outperforming 30 education systems (Appendix Table 1-16). At grade 8, the U.S. average mathematics score was among the top 16 (7 scored higher; 8 did not differ), outperforming 21 education systems. (Appendix Table 1-17). The same 5 Asian education systems—Singapore, Hong Kong, South Korea, Taiwan, and Japan—were the top scorers on the fourth and eighth grade assessments. All 5 outscored the United States by at least 50 points (Table 1-7).
Average TIMSS mathematics scores of U.S. students in grades 4 and 8, by selected student and school characteristics: 2015
Average TIMSS mathematics scores of students in grades 4 and 8, by education system: 2015
Performance trends. U.S. fourth and eighth graders have raised their scores and international ranking over the 20 years since the first TIMSS mathematics administration in 1995. At grade 4, the average mathematics score of 539 in 2015 was 21 points higher than the score of 518 in 1995 (Figure 1-3), although the 2015 average score was not significantly different from the most recent assessment in 2011 (541). The position of U.S. fourth graders relative to other nations climbed as well over this period: among the 16 education systems that participated in the 1995 and 2015 TIMSS mathematics assessment of fourth graders, 7 outscored the United States in 1995 compared with 5 in 2015 (Provasnik et al. 2016). At grade 8, the U.S. average score of 518 in 2015 reflected a 26-point increase over the 1995 score of 492 and an increase of 9 points since the most recent assessment in 2011 (509) (Figure 1-3). The relative standing of U.S. eighth graders’ mathematics performance also improved over this period: among the 15 countries that participated in the 1995 and 2015 TIMSS mathematics assessment of eighth graders, 5 outperformed the United States in 2015, down from 8 in 1995 (Provasnik et al. 2016).
Average TIMSS mathematics scores of U.S. students in grades 4 and 8: 1995–2015
TIMSS = Trends in International Mathematics and Science Study.
Note(s)
TIMSS mathematics assessment scores range from 0 to 1,000 for grades 4 and 8. U.S. fourth graders did not participate in TIMSS in 1999; score is interpolated. Average mathematics scores of students in grade 4 and grade 8 cannot be compared directly because the test items differ across grade levels to reflect the nature, difficulty, and emphasis of the subject matter taught in school at each grade.
Source(s)
Provasnik S, Malley L, Stephens M, Landeros K, Perkins R, Tang JH, Highlights From TIMSS and TIMSS Advanced 2015: Mathematics and Science Achievement of U.S. Students in Grades 4 and 8 and in Advanced Courses at the End of High School in an International Context, NCES 2017-002 (2016).
Science and Engineering Indicators 2018
Demographic differences. U.S. scores in 2015 differed according to the percentage of students eligible for free or reduced-price lunch at participants’ schools (Table 1-6). Students at schools with less than 10% of eligible students scored approximately 100 points higher than students at schools with 75% or more eligible students in fourth (600 versus 499) and eighth (573 versus 477) grade. In 2015, the average mathematics assessment score for male fourth graders (543) was higher than the average score for female fourth graders (536), but there was no statistically significant difference in average scores for male and female eighth graders. The average score for grade 4 Asian students (605) was significantly higher than that for white students (559), and both were significantly higher than the average scores for Hispanic (515) and black (495) students. A similar pattern was seen among grade 8 students.
Science Performance of U.S. Students in Grades 4 and 8 on TIMSS
Performance on the 2015 TIMSS science tests. In 2015, the U.S. average science scores were 546 for fourth graders and 530 for eighth graders (Table 1-8). As with mathematics, the effective score range for most students was about 200 points, with 80% of fourth graders scoring between 439 and 644 and 80% of eighth graders scoring between 421 and 631. At grade 4, the United States was among the top 14 education systems (7 scored higher; 6 did not differ), outperforming 33 among a total of 47 participants (Appendix Table 1-18). At grade 8, the U.S. average science score was also among the top 14 education systems (7 scored higher; 6 did not differ), outperforming 23 among a total of 37 participants (Appendix Table 1-19). As with mathematics, the 5 Asian education systems of Singapore, South Korea, Hong Kong, Taiwan, and Japan were among the top scorers on the science assessment at both grade levels (Table 1-9).
Average TIMSS science scores of U.S. students in grades 4 and 8, by selected student and school characteristics: 2015
Average TIMSS science scores of students in grades 4 and 8, by education system: 2015
Performance trends. In contrast to the mathematics trends, which showed significant improvement in both grades, the average scores of U.S. students on the TIMSS science assessment remained flat since 1995 for fourth graders but improved 17 points for eighth graders (Figure 1-4). U.S. fourth and eighth graders have not improved their international position in science achievement since 1995. Among the 17 education systems that participated in the 1995 and 2015 grade 4 TIMSS science assessments, the United States slipped in rank, from 3rd in 1995 to 5th in 2015; at grade 8, the position of the United States did not move between 1995 and 2015 (Provasnik et al. 2016).
Average TIMSS science scores of U.S. students in grades 4 and 8: 1995–2015
TIMSS = Trends in International Mathematics and Science Study.
Note(s)
TIMSS science assessment scores range from 0 to 1,000 for grades 4 and 8. U.S. fourth graders did not participate in TIMSS in 1999; score is interpolated. Average science scores of students in grade 4 and grade 8 cannot be compared directly because the test items differ across grade levels to reflect the nature, difficulty, and emphasis of the subject matter taught in school at each grade.
Source(s)
Provasnik S, Malley L, Stephens M, Landeros K, Perkins R, Tang JH, Highlights From TIMSS and TIMSS Advanced 2015: Mathematics and Science Achievement of U.S. Students in Grades 4 and 8 and in Advanced Courses at the End of High School in an International Context, NCES 2017-002 (2016).
Science and Engineering Indicators 2018
Demographic differences. As with mathematics, U.S. students’ science scores differed according to the percentage of students eligible for free or reduced-price lunch at participants’ schools, with students at schools with less than 10% of eligible students scoring approximately 100 points higher than students at schools with 75% or more eligible students at fourth (603 versus 502) and eighth (579 versus 489) grade (Table 1-8). At grade 4 and grade 8, there were no significant differences in average scores between male and female students. The average scores for Asian (598) and white (570) students in grade 4 were significantly higher than the scores for Hispanic (518) and black (501) students. A similar pattern was seen for students in grade 8.
U.S. Performance in TIMSS Advanced Mathematics and Physics at the End of High School
Only U.S. performance on TIMSS Advanced is reported here because countries varied in their rates of participation in the exam and in the characteristics of students taking the assessment, making it difficult to accurately rank education systems in order of performance. IEA calculates a coverage index for the advanced mathematics and physics exams for education systems participating in the exam. The coverage index is the percentage of all people in an age cohort who are students in their final year of secondary school who have taken or are taking advanced mathematics or physics courses. The corresponding age cohort is determined for education systems individually. In the United States, 18-year-olds are considered to be the corresponding age cohort. The U.S. coverage index was 11.4 for advanced mathematics and 4.8 for physics. The coverage index for advanced mathematics for other education systems ranged from 3.9 for Lebanon to 34.4 for Slovenia. The coverage index for physics ranged from 3.9 for Lebanon to 21.5 for France.
Performance trends. In 2015, the U.S. average scores were 485 in advanced mathematics and 437 in physics (Table 1-10). These scores are not significantly different from the scores reported for both exams in 1995 (Provasnik et al. 2016). The effective score range for the mathematics exam was about 250 points, with 80% of scores (from the 10th to the 90th percentiles) falling between 352 and 608. The score range for physics was larger, at more than 300 points, with 80% of scores falling between 283 and 589.
Demographic differences. U.S. students’ average scores on the advanced mathematics and physics assessments differed according to the percentage of students eligible for free or reduced-price lunch at participants’ schools (Table 1-10). In advanced mathematics, students at schools with less than 10% of students eligible scored more than 100 points higher than students at schools with 75% or more eligible (534 versus 425). In physics, the difference in average scores was nearly 150 points (506 versus 363). The average scores for U.S. male students on both TIMSS Advanced assessments were considerably higher than those for female students. Male students outperformed female students by 30 points on the TIMSS Advanced mathematics assessment and by 46 points on the physics assessment. The proportion of male and female students taking the advanced mathematics assessment was close to even, but the physics exam was skewed toward male students, with U.S. male students comprising 61% of exam takers (Provasnik et al. 2016). As with the fourth and eighth grade students in mathematics and science, the average scores on the advanced mathematics assessment were higher for white (495) and Asian (506) students than for Hispanic (440) and black (400) students. A similar pattern in average scores was seen among white, black, and Hispanic students on the TIMSS Advanced physics assessment.
Average advanced mathematics and physics scores of U.S. TIMSS Advanced students, by selected student and school characteristics: 2015
The Program for International Student Assessment
PISA assessments measure the performance of 15-year-old students in science and mathematics literacy every 3 years. Coordinated by the Organisation for Economic Co-operation and Development (OECD), PISA was first implemented in 2000 in 32 countries and has since grown to 73 education systems in 2015. Participants in PISA include countries and cities, so rankings should be assessed within that context. The United States has participated in every cycle of PISA since its inception in 2000. PISA’s goal is to assess students’ preparation for the challenges of life as young adults. The study assesses the application of knowledge in science, reading, and mathematics literacy to problems within a real-life context. Unlike TIMSS, PISA does not focus explicitly on school-based curricula and uses the term literacy in each subject area to indicate its broad focus on the application of knowledge and skills learned in and outside of school. For example, when assessing science, PISA examines how well 15-year-old students can understand, use, and reflect on science for various real-life problems and settings that they may encounter in and out of school (see sidebar Sample Items from the Program for International Student Assessment Mathematics and Science Assessments).
International Comparison of Mathematics Literacy among U.S. 15-Year-Olds
U.S. students’ average PISA mathematics score of 470 in 2015 was lower than the OECD average score of 490, on a scale of 0–1,000 (Table 1-11). The effective score range for U.S. students was 230 points, with 80% of students scoring between 355 and 585. The U.S. average score was lower than that of 36 other education systems and was not significantly different from 5 (Appendix Table 1-20). The top 5 performers were all located in Asia (Singapore, Hong Kong, Macau, Taiwan, and Japan), with average scores surpassing the U.S. score by at least 62 points (Table 1-12). The U.S. students’ average mathematics score was also lower than those of several developing countries, including Vietnam (495), Russia (494), and Lithuania (478).
Average scores of U.S. 15-year-old students on the PISA mathematics and science literacy scales, by selected student characteristics: 2015
Average mathematics literacy assessment scores for 15-year-olds participating in PISA, by education system: 2015
International Comparison of Science Literacy among U.S. 15-Year-Olds
The average PISA science literacy score for U.S. students in 2015 was 496, which was not significantly different from the OECD average of 493, on a scale of 0 to 1,000 (Table 1-11). The effective score range for U.S. students was 258 points, with 80% of students scoring between 368 and 626. The U.S. average score was lower than that of 18 other education systems and not significantly different from 12. The top 5 performers on the science exam were Singapore, Japan, Estonia, Taiwan, and Finland, and their average scores surpassed those of the United States by at least 35 points (Table 1-13). Unlike mathematics scores, the U.S. students’ average science score was higher than those of all developing countries participating in PISA in 2015 (Appendix Table 1-21).
Average science literacy assessment scores for 15-year-old students participating in PISA, by education system: 2015
Trends in Mathematics and Science Knowledge among 15-Year-Old Students in the United States: Results from PISA
Figure 1-5 shows the average mathematics and science literacy scores for 15-year-old students in the United States between 2003 and 2015. Scores decreased for mathematics since 2009 but stayed even for science. The U.S. average score in mathematics literacy in 2015 was 17 points lower than the average score in 2009 and 11 points lower than the average in 2012, but it was not significantly different from scores in 2003 and 2006. The U.S. average score in science in 2015 was not significantly different from the average scores observed in 2006, 2009, and 2012.
Average mathematics and science literacy assessment scores of 15-year-old students in the United States: 2003–15
Note(s)
The mathematics and science literacy assessment scores range from 0 to 1,000. Science data for 2003 are not available; science literacy assessment was not administered that year.
Source(s)
Kastberg D, Chan JY, Murray G, Performance of U.S. 15-Year-Old Students in Science, Reading, and Mathematics Literacy in an International Context: First Look at PISA 2015, NCES 2017-048 (2016).
Science and Engineering Indicators 2018
U.S. Performance on PISA, by Selected Student Characteristics
Average scores for students in the United States varied by SES, sex, and race or ethnicity on the mathematics and science PISA assessments (Table 1-11). The gap in the average scores between students in the highest and lowest socioeconomic quartiles was nearly 90 points on the mathematics assessment (517 versus 431) and the science assessment (546 versus 457). Average scores were also higher for male students than for female students on both assessments, with a gap of 9 points in favor of male students on the mathematics assessment and 7 points on science. Average mathematics scores for white (499) and Asian or Pacific Islander (498) students were higher than those of Hispanic (446) and black (419) students. Similar gaps by race or ethnicity were seen in science performance.