 |
Back to The Emergence of Tissue Engineering as a Research Field Bibliometric Analysis of Core Papers Fundamental to Tissue Engineering |
|
Back to Table of Contents View PDF of this document (81 Kb) VIII. Analysis of international patentingA. Methodology To compile the database of international patenting in tissue engineering, patents from more than 60 countries were searched using CHI's internal US, EP, and PCT databases as well as Derwent's World Patent Index. The search used the filter described in Appendix 2. Although the same filter was used, the patent set analyzed here differs from the set of 266 patents used to find core papers fundamental to tissue engineering. In this analysis the filter was used in a looser way; every patent abstract was not read. Some obviously irrelevant patents were excluded on a quick pass through, but for the most part, patents that met the filter were included. Thus, the 266 US patents are included in this analysis of international patenting, but there are more US patents here in addition. The equivalent patent documents for multiple countries were assembled into patent families, standardized and put into a database for analysis. Note that a patent family is a set of equivalent patent documents from different countries. For example, when a scientist invents something, he/she will typically file the patent in his/her home country, and then file equivalent patents in every country for which he/she wishes to have patent protection. Note that the equivalent patent documents are not different inventions, so when analyzing global technology it is best to consolidate the various patent documents into families in order to get an idea of the actual number of innovations. Because of the stringent copyright issues related to Derwent patents, the patent search was first done using CHI's databases, and then a supplementary search was done for any patents filed worldwide, but not filed in the US (US Patent Office), EP (European Patent Office), or PCT (Patent Cooperation Treaty A.K.A. World Patents, or World Intellectual Property Office Patents) systems. This was done for completeness, but as is often the case, it was found that the majority of patents could be found in the US, EP, and PCT systems. Specifically, some 851 patent documents were found, and assembled into 567 individual patent families. Ninety-two percent (523) of the patent families have at least one patent equivalent in the US/EP/PCT systems and there is strong evidence that the other 8% are more than likely of little value. We can make this latter claim because we see that the 44 patent families that are outside of the US/EP/PCT set mainly come from countries that are well represented in the US and EP systems. In particular 19 of the 44 are from Japan, and 10 of the 44 are from Germany. In the first case, because of the peculiarities of the Japanese patent system, patents filed only in Japan tend to be worth little so that only patents filed in Japan and at least one other patent system are studied by patent analysts. The additional patent systems in which Japanese inventors file their patents are usually patent systems where Japanese companies export, that is the US and Europe. Similarly, German patents that are only filed in Germany and not through the PCT, EP, or US systems tend to be patents from individual inventors and very small companies rather than major biotech and pharmaceutical companies. Note that a database of the 567 patent families accompany this report, but for the 44 Derwent patents we were only allowed to include the patent number, publication date, and our standardized assignee name; titles and other information were removed so as not to violate Derwent's copyright. B. Results
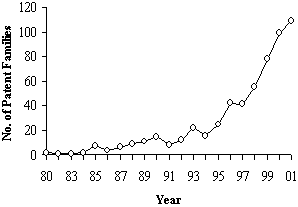
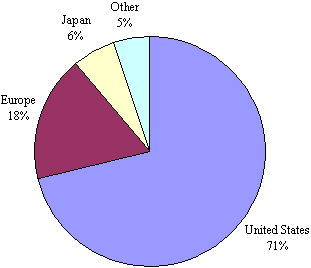
We see in Figure 4 that patenting in tissue engineering has been trending up since 1980 and has not yet peaked. In particular, in the last 5 years patenting has increased 226% over the previous 5 years, which in turn was an increase of 138% over the prior 5 years. The bulk of this innovation is coming from the US as we see in Figure 5. This figure shows the patents by priority country (or country of inventor) for the 567 worldwide patent families. We see that 71% of the global tissue engineering patents are invented in the US, followed by 18% in Europe (led by Germany and Great Britain) and 6% in Japan. The remaining 5% come from some 20 other countries including China with 4, Canada with 3, and 1 or 2 each from the remainder. Figure 5 - Priority (Inventor) Country of Worldwide Tissue Engineering Patents (1980-2001): N=567
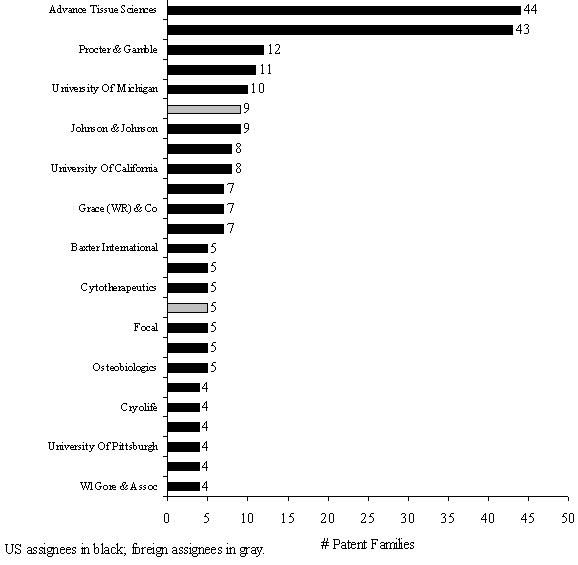
Given that most of the invention is coming from the US, it is not surprising to see that most of the patent assignees are US institutions. Figure 6 shows all assignees with 4 or more global patent families. Note that only 2 of the top 25 are foreign (assignees in black are US; assignees in gray are foreign). Top assignees include companies as well as universities. Prominent assignees include Advanced Tissue Sciences, MIT, Procter & Gamble, Regen Biologics and others. When trying to identify specific key patents within a technology such as this, one of the most accepted methods is using patent citation analysis. Numerous validation studies have shown associations between citations from later patents and various measures of success, such as increases in sales, profits, and stock prices, inventor awards, high expert opinion, and increased licensing opportunities. Since citations accumulate over time, analysts must take care to normalize the citations by age and technology. In this case, we normalized the patents by technology by computing the average citations received for all families within the tissue engineering set in each year. Since some years had few patents and were dominated by a few very highly cited patents, the citation norms were computed by fitting a curve to the actual yearly averages. Once the normalization values were established, we defined a highly cited patent family as one with at least 3 citations that has received 1.5 or more citations than expected, or a patent family that has received at least 20 citations total. Note that citing patents are not double counted, that is if 2 or more patent equivalents from a family each receive a citation from patent X, that citation is counted only once. A list of the 100 most highly cited tissue engineering patent families is given in Appendix 4 Table G. Note that the highest relative cited patent family is a 1999 Isotis patent that has received 11 citations already. Since a typical 1999 patent family has just over 1 citation, this patent is cited 7.5 times as often as expected. The US patent equivalent was chosen as the representative patent for the family. This patent is entitled: "Device for tissue engineering bone." The highest overall cited patent family is an Advanced Tissue Science invention "Three-dimensional cell and tissue culture system." This 1990 patent has received 162 citations from later patents, which is almost 6 times the expected number (28.3) for a 1990 tissue engineering patent family. Rather than detail each of the 100 patents, we will let the reader read through to identify patents of interest. We do note however that many of the highly cited patents are coming from the patenting leaders (in other analyses we've done, this has not always been the case). This is further illustrated in Table 4, where we see that MIT and Advanced Tissue Sciences have the most highly cited patents by far. Among the most effective patenting companies is Regen Biologics Inc., which has 8 of its 11 patents among the highly cited set. Figure 6 - Assignees with 4+ TE Global Patent Families (1980-2001) Table 4 - Share of patents that are highly cited by assignee
|


