Geography of S&T: Globalization of Capabilities
Why is this important?
Today's interdependent economies rely on science, engineering, and technology for innovations that will keep them competitive. To that end, many governments have adopted policies to build or improve national science and technology capabilities.
Key observations:
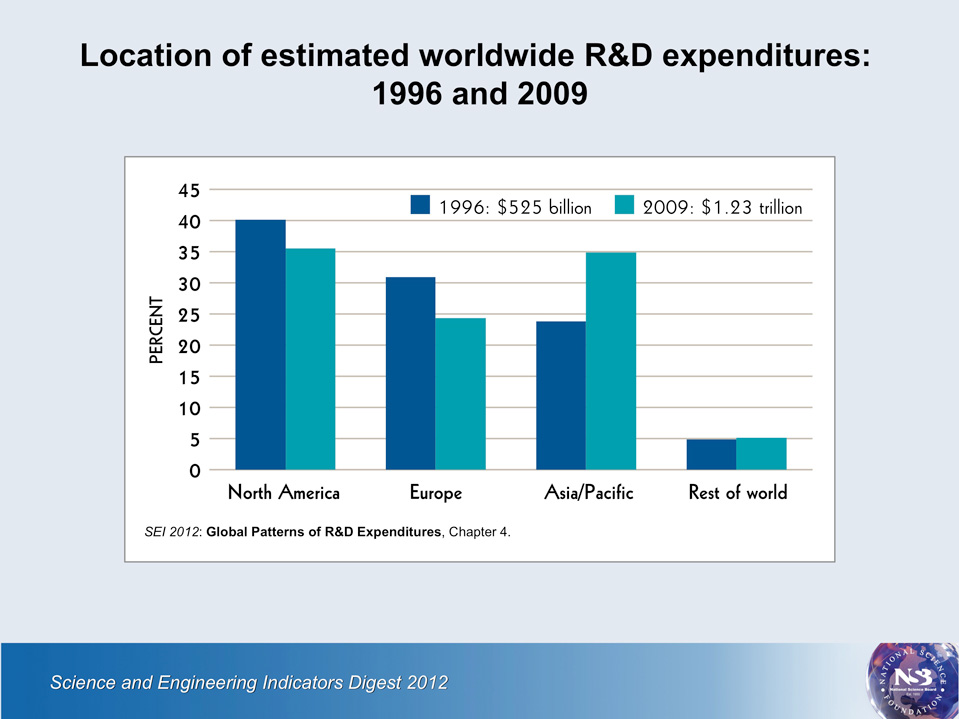
Location of estimated worldwide R&D expenditures: 1996 and 2009

- Excel data

- Powerpoint

- Image

Download:
Location of R&D
The geographic distribution of R&D expenditures shifted from 1996 to 2009. Asia's share rose to 35%, driven mostly by China's rapid R&D growth.
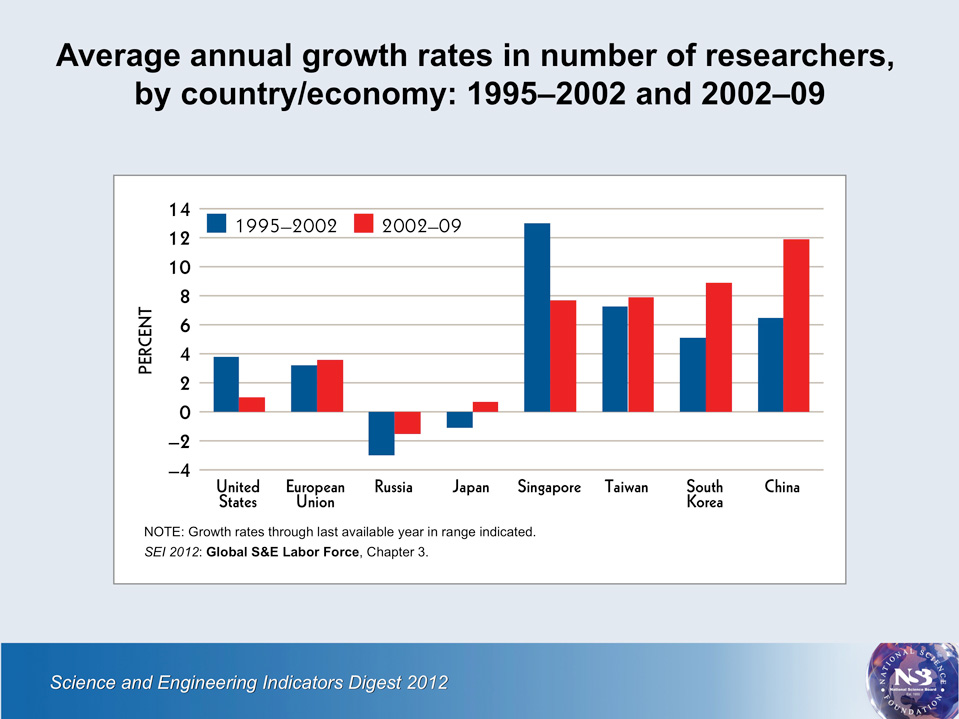
Average annual growth rates in number of researchers, by country/economy: 1995–2002 and 2002–09

- Excel data
- Powerpoint
- Image
Download:
SEI 2012: Global S&E Labor Force, Chapter 3.
Researchers
The estimated number of researchers worldwide grew from about 4 million in 1995 to about 6 million in 2009, with indications of slowing growth from 2008 to 2009.
Annual growth was generally slower through the early part of the decade but since 2002 has averaged about 8% to over 10% for South Korea, Singapore, Taiwan, and China. Japan registered little or no growth over the 1995—2009 period, and Russia's researcher pool declined.
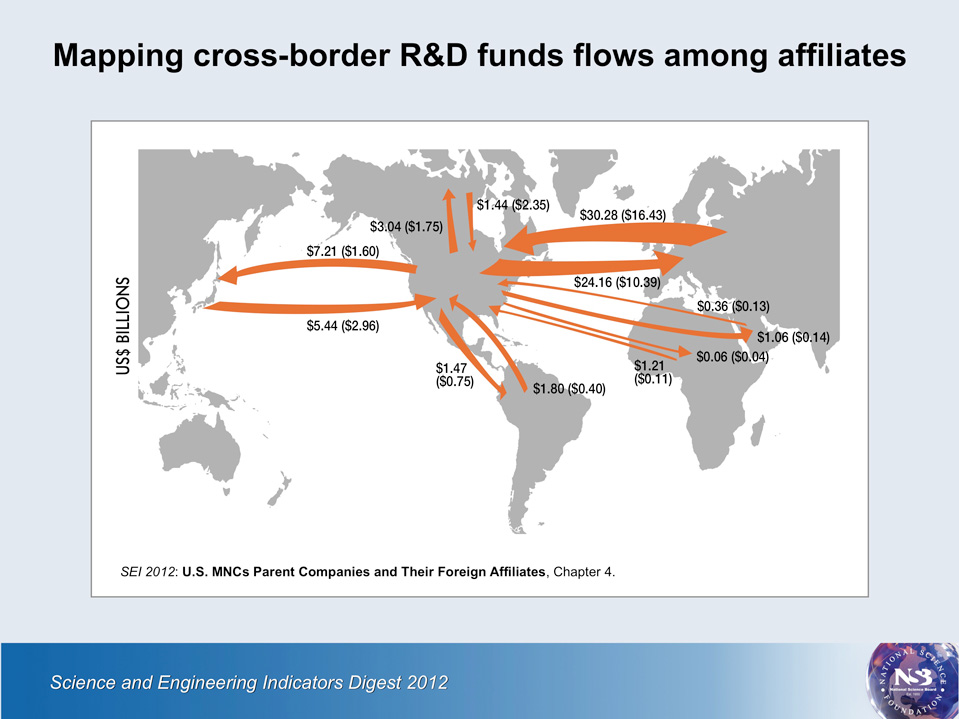
Mapping cross-border R&D funds flows among affiliates
US$ BILLIONS- Excel data
- Powerpoint
- Image
Download:
Cross-border R&D
R&D expenditures by overseas affiliates of U.S. multinational companies (MNCs) reached $37 billion in 2008. Europe's share of these overseas expenditures fell from 71% in 1998 to 65% in 2008, and Asia's share increased from 11% to 20% since 1998.
U.S.-based affiliates of foreign MNCs spent $40.5 billion in the United States in 2008, three-quarters of it by European-owned companies. Canada, Latin America, and Africa had smaller or little changed shares in 2008 compared with 1998; the Middle East had a larger share, driven by Israel.
High-technology manufacturing value-added, by country/region: 1995–2009

- Excel data
- Powerpoint
- Image
Download:
SEI 2012: High-Technology Manufacturing Industries, Chapter 6.
High-technology manufacturing
The United States, the EU, and China generate most of the value in the world's high-technology manufacturing output.
The worldwide recession changed trends in high-technology output growth around the world. U.S. growth nearly halted, and the EU, Japan, and Asia-8 experienced contraction in 2008 and 2009. Only China's output continued to grow rapidly, albeit at a somewhat slower pace than its previous double-digit growth.
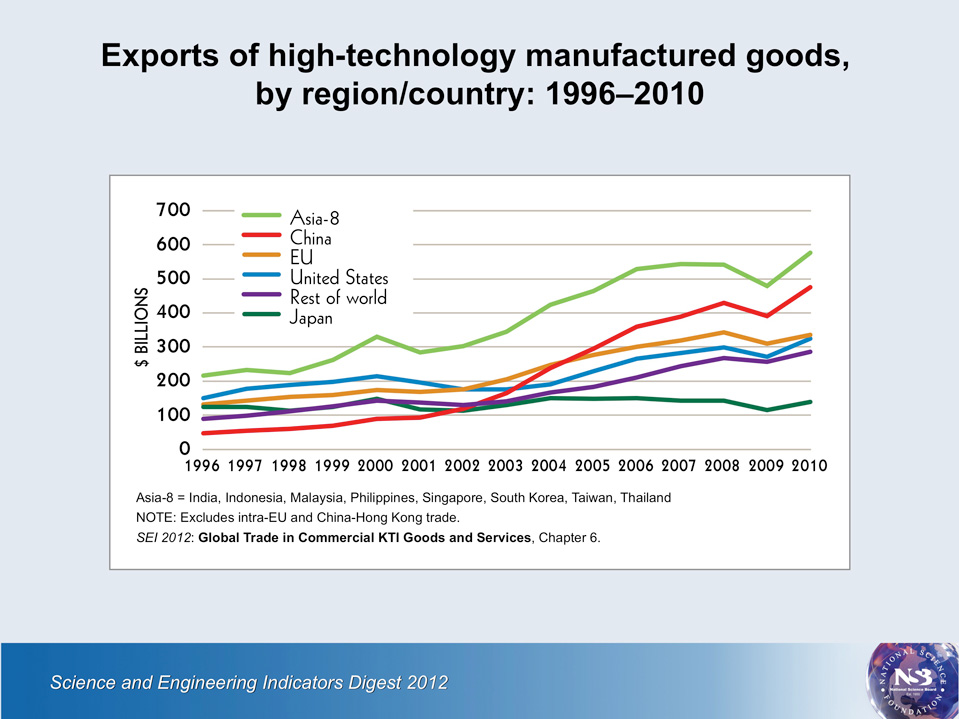
Exports of high-technology manufactured goods, by region/country: 1996–2010

- Excel data
- Powerpoint
- Image
Download:
NOTE: Excludes intra-EU and China-Hong Kong trade.
SEI 2012: Global Trade in Commercial KTI Goods and Services, Chapter 6.
High-technology exports
Exports of high-technology manufactured goods (excluding intra-EU and China-Hong Kong trade) expanded from $761 billion in 1996 to $2.14 trillion in 2010, amid major shifts in countries' export positions, including a 10% recession-induced drop in 2009. The 2010 recovery was 6% above 2008 peak levels.
The combined China and Asia-8 exports amounted to half the world's total, with Asia-8 exports including substantial intermediate goods trade with China and other Asian economies. The United States and EU each accounted for about 15% of world high-technology exports.
