New data from the National Center for Science and Engineering Statistics (NCSES) within the National Science Foundation indicate that research and experimental development (R&D)[2] performed in the United States totaled $547.9 billion in 2017 (table 1). The estimated total for 2018, based on performer-reported expectations, is $580.0 billion. These numbers compare with U.S. R&D totals of $493.7 billion in 2015 and $406.6 billion in 2010. (All amounts and calculations are reported in current dollars, unless otherwise noted.)
TABLE 1. U.S. R&D expenditures, by performing sector and source of funds: 2010–18
(Current and constant 2012 millions of dollars)
Performing sector and source of funds
2010
2011
2012
2013
2014
2015
2016
2017a
2018b
FFRDC = federally funded research and development center.
a Some data for 2017 are preliminary and may later be revised. b The data for 2018 are estimates and will later be revised. c Includes expenditures of federal intramural R&D as well as costs associated with administering extramural R&D procurements. d Some components of the R&D performed by other nonprofit organizations are projected and may later be revised.
NOTES: Data are based on annual reports by performers, except for the nonprofit sector. Expenditure levels for higher education, federal government, and nonfederal government performers are calendar year approximations based on fiscal year data.
SOURCE: National Center for Science and Engineering Statistics, National Patterns of R&D Resources (annual series).
The U.S. R&D system consists of the activities of a diverse group of R&D performers and sources of funding. Included here are private businesses, the federal government, nonfederal governments, higher education institutions, and other nonprofit organizations. The organizations that perform R&D often receive significant levels of outside funding, and organizations that fund R&D may also themselves be performers. The data for this InfoBrief mainly derive from NCSES surveys of the annual R&D expenditures of these performers and funders (see "Data Sources and Availability" for additional information).
Current Trends in U.S. Total R&D and R&D Intensity
U.S. Total R&D
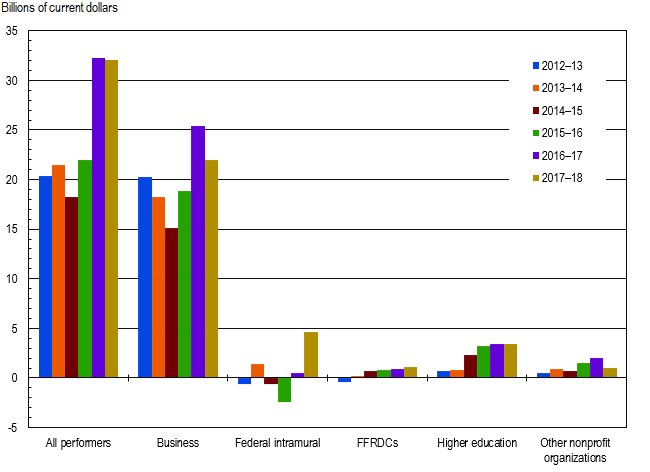
The 2010–17 period has seen sizable year-over-year increases in U.S. R&D expenditures, averaging $20.2 billion annually—a stark contrast with essentially no change between 2008 and 2010, a period marked by the impacts of the Great Recession. The 2018 estimate represents a $32 billion increase over the 2017 level. This pattern of sustained annual increase in U.S. total R&D is due mainly to consistently higher levels of business R&D performance (figure 1).
FIGURE 1. Year-to-year changes in U.S. R&D expenditures, by performer: 2012–18
FFRDC = federally funded research and development center.
NOTE: Data for 2017 are preliminary, and those for 2018 are estimates; some of these data may later be revised.
SOURCE: National Center for Science and Engineering Statistics, National Patterns of R&D Resources (annual series).
Adjusted for inflation, growth in U.S. total R&D averaged 2.7% annually over the 2010–17 period, moderately higher than the 2.2% average growth of U.S. gross domestic product (GDP) (table 2)[3]. By comparison, average annual growth of U.S. total R&D in the prior decade (2000–10), was lower at 2.1%, although it still outpaced the 1.7% rate of GDP expansion. The estimate for 2018 shows R&D growing at 3.3%, compared to GDP at 2.9%.
TABLE 2. Annual changes in U.S. R&D expenditures and gross domestic product, by performing sector: 1990–2018
(Percent)
Expenditures and gross
domestic product
Longer-term trends
Most recent years
1990–2000
2000–10
2010–17
2010–11
2011–12
2012–13
2013–14
2014–15
2015–16
2016–17
2017–18
NA = not available.
FFRDC = federally funded research and development center.
a Includes expenditures of federal intramural R&D as well as costs associated with administering extramural R&D procurement. b Survey data on state internal R&D performance was not available prior to 2006; state data for 2008 were not collected. c Some components of the R&D performed by other nonprofit organizations are projected and may later be revised.
NOTES: Longer term trend rates are calculated as compound annual growth rates. Data for 2018 are estimates and will later be revised.
SOURCE: National Center for Science and Engineering Statistics, National Patterns of R&D Resources (annual series).
The ratio of total national R&D expenditures to GDP is widely used by national statistical offices and other policy analysts as an overall gauge of the intensity of a nation's R&D effort. In this new edition of the National Patterns data, the ratio of U.S. R&D to GDP was 2.81% in 2017 and estimated to be 2.82% in 2018.[4]
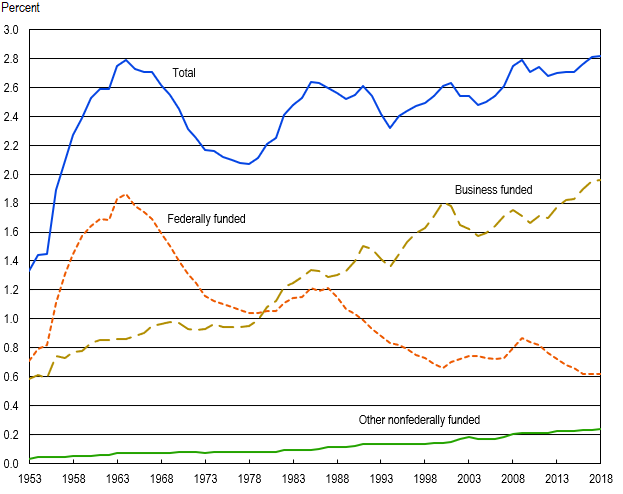
The U.S. ratio generally has been rising since the mid-1990s, though with some periods of decline (figure 2). The highest U.S. ratios recorded are 2.79% in 1964, 2.79% in 2009, 2.81% in 2017, and estimated 2.82% in 2018.[5]
FIGURE 2. Ratio of U.S. R&D to gross domestic product, by source of funding for R&D: 1953–2018
NOTES: Data for 2017 are preliminary, and those for 2018 are estimates; some of these data may later be revised. The federally funded data represent the federal government as a funder of R&D by all performers; similarly the business-funded data represent businesses as funders of R&D by all performers. The other nonfederal category includes R&D funded by all other sources—mainly, higher education, nonfederal government, and other nonprofit organizations. The gross domestic product (GDP) data used reflect the Bureau of Economic Analysis's comprehensive revisions of the National Income and Product Accounts of August 2019.
SOURCE: National Center for Science and Engineering Statistics, National Patterns of R&D Resources (annual series).
Most of the rise in R&D-to-GDP ratio over the past several decades owes to the increase of nonfederal spending on R&D, particularly by the business sector. This arises largely from the growing role of business R&D in the national R&D system, which in turn reflects the increase of R&D-dependent goods and services in the national and global economies. By contrast, the share of federally funded R&D expenditures declined from the mid-1980s to the late 1990s, notably from cuts in defense-related R&D. This was followed by a gradual uptick through 2009, driven by increased federal spending on biomedical and national security R&D and the one-time incremental funding for R&D provided by the American Recovery and Reinvestment Act of 2009 (ARRA). The federally funded share, however, has returned to a path of mainly decline since 2010 (figure 2).
Performers of R&D
Business
The business sector is by far the largest performer of U.S. R&D. In 2017, domestically performed business R&D accounted for $400.1 billion, or 73% of the $547.9 billion national R&D total (tables 1 and 3)[6]. The business sector's predominance in national R&D performance has long been the case, with its annual share ranging between 69% and 73% in 2000–17.[7]
TABLE 3. U.S. R&D expenditures, by performing sector, source of funds, and type of work: 2017
(Millions of dollars and percent distribution)
Performing sector and type of work
Source of funds ($millions)
Percent
distribution by
performer
Total
Business
Federal
government
Nonfederal
government
Higher
education
Other
nonprofit
organizations
* = small to negligible amount, included as part of the funding provided by other sectors.
FFRDC = federally funded research and development center.
NOTES: Data for 2017 include some estimates and may later be revised. Some components of R&D performance and funding by other nonprofit organizations are projected and may later be revised.
SOURCE: National Center for Science and Engineering Statistics, National Patterns of R&D Resources (annual series).
Adjusted for inflation, growth in business R&D averaged 3.6% annually during this period, well ahead of the 2.7% annual average for U.S. total R&D and the 2.2% annual average for GDP (table 2).
Higher Education
R&D performed in the United States by the higher education sector totaled $71.3 billion in 2017, or 13% of U.S. total R&D (tables 1 and 3). Over the period 2000–17, the higher education share of U.S. R&D has ranged between 11% and 14%.
Adjusted for inflation, growth in this sector's R&D performance averaged 1.3% annually in 2010–17, well behind both U.S. total R&D (2.7%) and GDP (2.2%). The year-by-year trajectory in higher education R&D expenditures has been marked by contrasts: relatively high growth in 2010 and 2011, noticeable slowdown in 2012–14, and return to substantial growth in 2015–17 (table 2).
Federal Agencies and Federally Funded Research and Development Centers
The federal government performed $52.6 billion, or 10%, of the U.S. R&D total in 2017 (tables 1 and 3). This included $32.2 billion (6% of the U.S. total) performed by the intramural R&D facilities of federal agencies and $20.3 billion (4%) performed by the 42 federally funded research and development centers (FFRDCs). The federal share of U.S. R&D performance rose from about 11% in 2000 to 12% in 2010, but has declined since then, down to about 10% in 2017.
Adjusted for inflation, this sector's R&D performance in 2010–17 declined at an annual average rate of 1.1%—a sharp contrast to the growth in total U.S. R&D (2.7%) and GDP (2.2%) over the same period (table 2). In the previous decade (2000–10), federal R&D performance grew an average of 3.8% yearly, well ahead of U.S. total R&D (2.1%). The reversal in the 2010–17 period reflects mainly the waning after 2010 of the incremental funding from ARRA and the more challenging environment for federal budget support after 2011. (Also, starting in 2016, a revision to the guidelines governing federal agency reporting of R&D expenditures reduced—particularly for the Department of Defense—the reported level of federal intramural R&D performance by $5 billion to $7 billion annually compared to prior years.[8])
State Government
State agency intramural R&D performance in 2017 is estimated to be $641 million—a small share (about 0.1%) of the U.S. total (tables 1 and 3). This includes all 50 states and the District of Columbia.
Other Nonprofit Organizations
R&D performed in the United States by other nonprofit organizations (which excludes universities and FFRDCs) was an estimated $23.3 billion in 2017 (tables 1 and 3). This was 4% of U.S. total R&D, a share estimated to have increased only slightly since the late 1990s.
Sources of R&D Funding
Business
Matching its predominant role in R&D performance, the business sector is also the leading source of funding for R&D performed in the United States. In 2017, business sector funding accounted for $381.1 billion, or 70%, of U.S. total R&D performance (table 3). Nearly all (98%) of the business sector's funding for R&D that year supported business R&D performance—whether performed by the company itself or in support of the R&D performed by other companies.[9] The remainder went to R&D performers in higher education, other nonprofit organizations, and FFRDCs.
The business sector's dominant role in U.S. R&D funding began in the early 1980s, when its support started to exceed 50% of the total. In 2000–17, the business sector's funding share ranged from 61% to 70% annually.
Federal Government
The federal government is the second-largest source of funding for U.S. R&D, behind the business sector. It is a major resource for most of the U.S. R&D performer sectors, except the business sector, where the federal role is overshadowed by business's own funds.
Funds from the federal government accounted for $121.0 billion, or 22%, of U.S. total R&D in 2017 (table 1). Federal funding was directed mainly to R&D performance by the federal government, businesses, and higher education (table 3). In 2017, federal funding supported about 51% of academic R&D performance; 6% of business R&D performance; 35% of nonprofit R&D performance; and almost all (98%) of FFRDC R&D performance.
Several decades ago, the federal government was the leading sponsor of the nation's R&D—funding 67% of all U.S. R&D in 1964 (figure 2). The federal share decreased to half (49%) of all funding in the late 1970s, to a little over a third (36%) in the mid-1990s, and to a quarter (25%) by the turn of the century. (A major factor in the decrease of the federal share of national R&D was the sharp decline in funding for space R&D after the United States won the race to the moon in the late 1960s. At largely the same time, the business sector was rapidly expanding its energy-related R&D in response to the world oil supply crises.) The share ticked up again to 31% in 2009 and 2010, amid changing business conditions and expanded federal funding for health, defense, and counterterrorism R&D (including ARRA funding). The federal share, however, again declined in the subsequent years and stands at 22% in 2017. As with the recent decline in the federal share of R&D performance, this decline in the federal share of R&D funding reflects a waning after ARRA and the more challenging federal budget environment since 2011.
Other Sources
The remainder of R&D funding from other sources is a smaller component: $45.8 billion in 2017, or about 8% of all U.S. R&D performance (table 3). Of this amount, $19.7 billion was from higher education's own institutional funds, all of which remain in the academic sector; $4.6 billion was from state and local governments, primarily supporting academic research; and $21.5 billion was from other nonprofit organizations, mostly funding this sector's own R&D. Of the estimated nonprofit total, some funds ($7.2 billion) support R&D in higher education, and small amounts support business ($0.8 billion) and FFRDC ($0.2 billion) R&D performance.
R&D by Type of Work
In 2017, basic research activities accounted for $91.5 billion, or 17% of total U.S. R&D expenditures (table 4). Applied research was $108.8 billion, or 20% of the total. Most of the total of U.S. R&D expenditures was experimental development at $347.6 billion, or 63%.
TABLE 4. U.S. R&D expenditures, by type of work: Selected years, 2000–18
(Current and constant 2012 dollar billions and percent distribution)
Type of work
2000
2010
2012
2013
2014
2015
2016
2017a
2018b
a Some data for 2017 are preliminary and may later be revised. b The data for 2018 are estimates and will later be revised.
NOTES: Data throughout the time series reported here are consistently based on Organisation for Economic Co-operation and Development Frascati Manual definitions for basic research, applied research, and experimental development. Prior to 2010, however, some changes were introduced in the questionnaires of the sectoral expenditure surveys to improve the accuracy of respondents' classification of their R&D. Therefore, small percentage changes in the historical data may not be meaningful.
SOURCE: National Center for Science and Engineering Statistics, National Patterns of R&D Resources (annual series).
Higher education accounted for just under half (48%) of the $91.5 billion of basic research in 2017 (table 3). The business sector was the second-largest basic research performer (27%). Business was the majority performer (57%) of the $108.8 billion of applied research in 2017. Higher education was second at 18%; federal intramural performers plus FFRDCs amounted to 17% of the applied research total. Business continued to dominate experimental development, accounting for 90% of the $347.6 billion of that category in 2017.
Federal funding accounted for 42% of the $91.5 billion of basic research in 2017. But federal funds were less prominent for applied research (35% of $108.8 billion) and experimental development (13% of $347.6 billion). The business sector provided the greatest share of funding for applied research (54%) and the predominant share for experimental development (85%). It also accounted for a sizable share (29%) of funding for basic research.
The shares of U.S. total R&D expenditures among the three types of R&D have remained largely stable over the 2010–17 period—essentially the same for applied research, somewhat less for basic research, and somewhat more for experimental development (table 4). Adjusted for inflation, about $6 billion more in basic research was performed in 2017 than in 2010, $19 billion more in applied research, and $61 billion more in experimental development.
Between 2010 and 2017, the most notable shifts in the relative roles of performers and funders were in basic research. In 2010, businesses performed 22% of U.S. basic research, but the sector's role rose to 27% in 2017 (partly because of substantial increases in basic research performed by the pharmaceuticals and medicines industries, as well as the professional, scientific, and technical services sector). Over the same period, the share of U.S. basic research performed by higher education institutions—historically, the nation's largest basic research performer—declined from 50% in 2010 to 48% in 2017. Businesses funded 23% of U.S. basic research in 2010, rising to 29% in 2017. Over the same period, the federally funded share declined from 53% in 2010 to 42% in 2017.
Data Sources and Availability
The statistics on U.S. R&D presented in this report derive mainly from integrating the data on R&D expenditures and funding collected by NCSES's annual national surveys on the organizations that perform and fund the vast majority of U.S. R&D. In some cases, the primary data from these surveys are adjusted to enable consistent integration of the statistics across these separately conducted surveys. In addition, preliminary or otherwise estimated values may be used where final data from one or more of the surveys are not yet available but can reasonably be calculated.
The R&D surveys involved include NCSES's Business Research and Development Survey (for 2017–18; for 2008–16, the preceding Business R&D and Innovation Survey; for 2007 and earlier years, the Survey of Industrial R&D), the Higher Education Research and Development Survey (for FYs 2010–18; for 2009 and earlier years, the preceding Survey of R&D Expenditures at Universities and Colleges), the Survey of Federal Funds for Research and Development (FYs 2018–19 and earlier years), and the FFRDC Research and Development Survey (FY 2018 and earlier years).[10] Amounts for the R&D performed by other nonprofit organizations with funding from the nonprofit sector and from business sources are estimated, based on parameters from the 1996–97 Survey of R&D Funding and Performance by Nonprofit Organizations.
A full set of detailed statistical tables associated with the National Patterns data will be available in the report National Patterns of R&D Resources: 2017–18 Data Update, at https://www.nsf.gov/statistics/natlpatterns/. This supplementary report also provides further details on the nature of the data and the National Patterns methodologies. For further information and questions, contact the author.
Notes
[1] Mark Boroush, Research and Development Statistics Program, National Center for Science and Engineering Statistics, National Science Foundation, 2415 Eisenhower Avenue, Suite W14200, Alexandria, VA 22314 (mboroush@nsf.gov; 703-292-8726).
[2]Research and experimental development comprise creative and systematic work undertaken in order to increase the stock of knowledge—including knowledge of humankind, culture, and society—and to devise new applications of available knowledge. Basic research: Experimental or theoretical work undertaken primarily to acquire new knowledge of the underlying foundations of phenomena and observable facts, without any particular application or use in view. Applied research: Original investigation undertaken in order to acquire new knowledge; directed primarily toward a specific, practical aim or objective. Experimental development: Systematic work, drawing on knowledge gained from research and practical experience and producing additional knowledge, which is directed to producing new products or processes or to improving existing products or processes. (Organisation for Economic Co-Operation and Development, Frascati Manual 2015: Guidelines for Collecting and Reporting Data on Research and Experimental Development. 7th ed. Paris.)
[3] In this report, dollars adjusted for inflation (i.e., constant dollars) are based on the GDP implicit price deflator (currently in 2012 dollars) as published by the Department of Commerce, Bureau of Economic Analysis (BEA) (https://www.bea.gov/iTable/index_nipa.cfm). Note that GDP deflators are calculated on an economy-wide scale and do not explicitly focus on R&D.
[4] By comparison, against the world's other largest R&D performers in 2017, the U.S.'s 2017 ratio was well ahead of China's 2.15%, France's 2.19%, and the United Kingdom's 1.66%. But it was behind Germany's 3.04% and Japan's 3.20%, and considerably behind South Korea's 4.55%. (Organisation for Economic Co-Operation and Development, Main Science and Technology Indicators, 2019/1, Paris.)
[5] Due to sample variability in the data for the business R&D component, the calculated R&D-to-GDP ratios for 1965, 2009, 2017, and 2018 are not significantly different from one another at a 90% confidence level.
[6] R&D performed in the domestic United States by businesses occurs widely in manufacturing and nonmanufacturing. Presently, most occurs in five sectors: chemicals manufacturing (which includes the pharmaceuticals industry); computer and electronic products manufacturing; transportation equipment manufacturing (which includes the automobiles and aerospace industries); information (which includes the software publishing industry); and professional, scientific, and technical services (which include the computer systems design and scientific R&D services industries). For further details and statistics, see the current report of the NCSES Business Research and Development Survey, https://www.nsf.gov/statistics/srvybrds/.
[7] Historical data not illustrated in the tables and figures in this report can be found in the full set of detailed statistical tables available at https://ncses.nsf.gov/pubs/nsf20307/.
[8] Starting in FY 2016 and thereafter, the data on federal intramural R&D exclude expenditures for preproduction development. (Preproduction development is nonexperimental work on a product or system before it goes into full production. For example, activities and programs that are categorized as "Operational Systems Development" in the DOD's Research, Development, Test, and Evaluation [RDT&E] budget activity structure.) This change aligns the federal intramural data with a recent change introduced in the definition of R&D by the U.S. Office of Management and Budget. In FYs 2016–18, federal intramural preproduction development totaled $5 billion to $7 billion each year.
[9] Business funding by business in this report refers to business funding for domestic business R&D performance plus business funding for FFRDCs and U.S. higher education and other nonprofit R&D performers.
[10] Estimates from the Business Research and Development Survey, the Business R&D and Innovation Survey, and the Survey of Industrial R&D are all derived from sample data and thereby contain sampling error. Consequently, estimates of total U.S. R&D also contain sampling error. For more information on this topic and other surveys used in the National Patterns tabulations, please see the technical notes in the accompanying data update at https://www.nsf.gov/statistics/natlpatterns/.