NOTE: Because of rounding, detail may not add to total.
SOURCE: National Center for Science and Engineering Statistics, Survey of Federal Funds for Research and Development, FYs 2018–19.
by Christopher Pece[1]
Federal obligations[2] for research and development totaled $129.4 billion in FY 2018, up 8.8% from FY 2017. Federal obligations for research increased 6.7% to $74.6 billion in FY 2018, while experimental development increased 11.7% to $54.8 billion. Obligations for R&D plant increased 45.3% to $3.9 billion during the same period. Preliminary estimates for FY 2019 obligations indicate further increases in R&D to an estimated $141.5 billion, an increase of 9.3%, with $83.4 billion for research and $58.1 billion for experimental development. Preliminary estimates show FY 2019 R&D plant increased 18.8% from FY 2018, to an estimated $4.6 billion (table 1). Data presented in this InfoBrief are in current dollars unless stated otherwise.
| Type of R&D, performer, and field | 2016 | 2017 | 2018 | Preliminary 2019 |
% change 2016–17 |
% change 2017–18 |
Preliminary % change 2018–19 |
|---|---|---|---|---|---|---|---|
FFRDC = federally funded research and development center; nec = not elsewhere classified. a Intramural activities cover costs associated with the administration of intramural R&D programs and extramural R&D procurements by federal personnel as well as actual intramural performance. NOTES: Because of rounding, detail may not add to total. Percentages are computed using actual dollars reported. SOURCE: National Center for Science and Engineering Statistics, Survey of Federal Funds for Research and Development. |
|||||||
| Obligations for R&D and R&D plant | 118,273.8 | 121,626.6 | 133,277.5 | 146,076.7 | 2.8 | 9.6 | 9.6 |
| R&D | 115,832.8 | 118,974.8 | 129,424.8 | 141,500.9 | 2.7 | 8.8 | 9.3 |
| Performer | |||||||
| Intramurala | 32,350.8 | 30,990.2 | 35,953.4 | 39,565.0 | -4.2 | 16.0 | 10.0 |
| Industry | 35,811.1 | 37,875.4 | 39,753.7 | 43,577.8 | 5.8 | 5.0 | 9.6 |
| FFRDCs | 11,422.8 | 11,694.1 | 12,455.5 | 14,871.6 | 2.4 | 6.5 | 10.6 |
| Universities and colleges | 28,199.3 | 28,963.2 | 31,534.1 | 33,359.2 | 2.7 | 8.9 | 5.8 |
| Other nonprofit institutions | 6,681.9 | 8,140.6 | 8,450.8 | 8,880.1 | 21.8 | 3.8 | 5.1 |
| State and local governments | 542.5 | 553.4 | 561.9 | 435.4 | 2.0 | 1.5 | -22.5 |
| Foreign | 824.3 | 757.9 | 715.4 | 811.7 | -8.1 | -5.6 | 13.5 |
| Research | 67,104.6 | 69,871.3 | 74,587.6 | 83,442.8 | 4.1 | 6.7 | 11.9 |
| Field of science and engineering | |||||||
| Computer sciences and mathematics | 4,222.8 | 3,894.2 | 4,206.9 | 4,545.7 | -7.8 | 8.0 | 8.1 |
| Engineering | 12,971.5 | 13,207.4 | 13,758.6 | 17,131.7 | 1.8 | 4.2 | 24.5 |
| Environmental sciences | 4,450.4 | 4,469.6 | 4,567.6 | 6,014.1 | 0.4 | 2.2 | 31.7 |
| Life sciences | 32,045.4 | 34,089.6 | 36,994.4 | 38,985.2 | 6.4 | 8.5 | 5.4 |
| Physical sciences | 6,705.6 | 6,581.5 | 7,881.4 | 9,063.9 | -1.9 | 19.8 | 15.0 |
| Psychology | 2,021.4 | 2,081.2 | 2,326.9 | 2,485.1 | 3.0 | 11.8 | 6.8 |
| Social sciences | 1,226.7 | 1,027.2 | 1,039.4 | 1,169.6 | -16.3 | 1.2 | 12.5 |
| Other sciences nec | 3,460.8 | 4,520.6 | 3,812.4 | 4,047.5 | 30.6 | -15.7 | 6.2 |
| Basic research | 32,292.7 | 33,271.5 | 36,195.1 | 39,684.6 | 3.0 | 8.8 | 9.6 |
| Applied research | 34,812.0 | 36,599.8 | 38,392.4 | 43,758.2 | 5.1 | 4.9 | 14.0 |
| Experimental development | 48,728.1 | 49,103.5 | 54,837.2 | 58,058.1 | 0.8 | 11.7 | 5.9 |
| R&D plant | 2,441.0 | 2,651.8 | 3,852.7 | 4,575.8 | 8.6 | 45.3 | 18.8 |
Data are from the latest edition of the Survey of Federal Funds for Research and Development, sponsored by the National Center for Science and Engineering Statistics within the National Science Foundation (NSF). Data for FY 2018 are actual amounts, and the FY 2019 data are preliminary and subject to revision.
Federal funds for R&D are obligated to a variety of different performers of R&D. Federal intramural performers saw the largest year-to-year growth between FY 2017 and FY 2018 (16.0%) to a total of $36.0 billion. In FY 2018, the majority (72.2%, or $93.5 billion) of R&D obligations were made to extramural performers (table 2). Different sectors of R&D performance are more concentrated in their reliance on specific agencies for funding. For example, the Department of Defense (DOD) accounts for 70.5% of all federal R&D obligations to industrial performers ($28.0 billion of $39.8 billion). The Department of Health and Human Services (HHS), on the other hand, accounts for just 4.7% ($1.9 billion) of all federal R&D obligations to industry but 63.2% ($19.9 billion) of these obligations to higher education institutions ($31.5 billion) and 68.0% ($5.7 billion) of these obligations to nonprofit institutions ($8.5 billion). NSF provided the second-largest share (14.8%) of funding to universities and colleges. Three agencies account for 90.1% ($11.2 billion) of all R&D obligations to the federally funded research and development centers ($12.5 billion); the Department of Energy (DOE) is the largest at 60.2% ($7.5 billion), followed by the National Aeronautics and Space Administration (NASA) (16.3%, or $2.0 billion) and DOD (13.5%, or $1.7 billion).
| Agency | Total R&D | Intramurala | Extramural | ||||||
|---|---|---|---|---|---|---|---|---|---|
| United States and U.S. territories | |||||||||
| Total | FFRDCs | Industry | Universities and colleges |
Other nonprofits |
State, local governments |
Foreign | |||
FFRDC = federally funded research and development center. a Intramural activities cover costs associated with the administration of intramural R&D programs and extramural R&D procurements by federal personnel as well as actual intramural performance. NOTE: Because of rounding, detail may not add to total. SOURCE: National Center for Science and Engineering Statistics, Survey of Federal Funds for Research and Development, FYs 2018–19. |
|||||||||
| All agencies | 129,424.8 | 35,953.4 | 93,471.4 | 12,455.5 | 39,753.7 | 31,534.1 | 8,450.8 | 561.9 | 715.4 |
| Departments | |||||||||
| Department of Agriculture | 2,478.6 | 1,550.4 | 928.2 | 0.0 | 34.0 | 858.4 | 24.4 | 8.2 | 3.2 |
| Department of Commerce | 1,438.7 | 1,027.3 | 411.3 | 24.0 | 52.1 | 303.6 | 22.9 | 7.4 | 1.3 |
| Department of Defense | 52,973.3 | 18,998.9 | 33,974.4 | 1,682.5 | 28,029.6 | 2,958.8 | 890.2 | 36.1 | 377.2 |
| Department of Education | 266.2 | 10.3 | 256.0 | 0.0 | 18.3 | 173.2 | 63.0 | 1.0 | 0.5 |
| Department of Energy | 12,832.4 | 1,336.0 | 11,496.3 | 7,501.5 | 2,375.1 | 1,350.1 | 199.1 | 69.0 | 1.5 |
| Department of Health and Human Services | 36,911.3 | 8,315.1 | 28,596.3 | 638.1 | 1,887.1 | 19,935.2 | 5,744.4 | 156.3 | 235.2 |
| Department of Homeland Security | 911.8 | 364.5 | 547.2 | 90.0 | 395.2 | 42.5 | 12.3 | 0.3 | 6.9 |
| Department of Housing and Urban Development | 62.0 | 52.9 | 9.0 | 0.0 | 4.5 | 3.0 | 1.5 | 0.0 | 0.0 |
| Department of the Interior | 765.6 | 669.5 | 96.0 | 1.3 | 9.0 | 49.7 | 0.9 | 33.9 | 1.2 |
| Department of Justice | 106.6 | 8.2 | 98.5 | 0.0 | 9.1 | 53.5 | 29.5 | 6.4 | 0.0 |
| Department of Labor | 4.8 | 3.4 | 1.4 | 0.0 | 1.4 | 0.0 | 0.0 | 0.0 | 0.0 |
| Department of State | 62.1 | 62.1 | 0.0 | 0.0 | 0.0 | 0.0 | 0.0 | 0.0 | 0.0 |
| Department of Transportation | 1,046.0 | 210.4 | 835.6 | 79.7 | 361.8 | 115.2 | 56.5 | 221.7 | 0.7 |
| Department of the Treasury | 37.7 | 0.0 | 37.7 | 5.3 | 32.4 | 0.0 | 0.0 | 0.0 | 0.0 |
| Department of Veterans Affairs | 1,349.0 | 1,276.5 | 72.5 | 72.5 | 0.0 | 0.0 | 0.0 | 0.0 | 0.0 |
| Other agencies | |||||||||
| Administrative Office of the U.S. Courts | 6.8 | 0.0 | 6.8 | 6.8 | 0.0 | 0.0 | 0.0 | 0.0 | 0.0 |
| Agency for International Development | 166.6 | 8.7 | 157.8 | 0.0 | 21.8 | 56.1 | 40.9 | 0.0 | 39.0 |
| Appalachian Regional Commission | 0.5 | 0.0 | 0.6 | 0.0 | 0.0 | 0.3 | 0.3 | 0.0 | 0.0 |
| Consumer Product Safety Commission | 1.0 | 1.0 | 0.0 | 0.0 | 0.0 | 0.0 | 0.0 | 0.0 | 0.0 |
| Environmental Protection Agency | 487.4 | 255.0 | 232.4 | 0.7 | 180.6 | 51.1 | 0.0 | 0.0 | 0.0 |
| Federal Communications Commission | 5.5 | 5.5 | 0.0 | 0.0 | 0.0 | 0.0 | 0.0 | 0.0 | 0.0 |
| Federal Trade Commission | 5.8 | 5.8 | 0.0 | 0.0 | 0.0 | 0.0 | 0.0 | 0.0 | 0.0 |
| Library of Congress | 3.3 | 3.3 | 0.0 | 0.0 | 0.0 | 0.0 | 0.0 | 0.0 | 0.0 |
| National Aeronautics and Space Administration | 10,716.7 | 1,484.2 | 9,232.5 | 2,034.1 | 5,779.3 | 895.5 | 495.9 | 1.6 | 26.1 |
| National Archives and Records Administration | 0.5 | 0.4 | 0.1 | 0.0 | 0.0 | 0.1 | 0.0 | 0.0 | 0.0 |
| National Science Foundation | 5,849.5 | 13.3 | 5,836.2 | 281.6 | 465.4 | 4,675.7 | 372.9 | 20.1 | 20.5 |
| Nuclear Regulatory Commission | 77.7 | 28.7 | 49.0 | 37.2 | 7.2 | 1.7 | 0.9 | 0.0 | 2.0 |
| Patient-Centered Outcomes Research Trust Fund | 491.7 | 0.0 | 491.7 | 0.0 | 0.0 | 0.0 | 491.7 | 0.0 | 0.0 |
| Smithsonian Institution | 227.9 | 227.9 | 0.0 | 0.0 | 0.0 | 0.0 | 0.0 | 0.0 | 0.0 |
| Social Security Administration | 71.6 | 34.2 | 37.4 | 0.0 | 25.2 | 8.3 | 3.7 | 0.0 | 0.2 |
| Tennessee Valley Authority | 13.2 | 0.0 | 13.2 | 0.0 | 13.2 | 0.0 | 0.0 | 0.0 | 0.0 |
| U.S. Postal Service | 53.2 | 0.0 | 53.2 | 0.0 | 51.2 | 2.0 | 0.0 | 0.0 | 0.0 |
Federal intramural R&D is the second-largest performing sector of all federal R&D obligations, with only obligations to private industrial performers being larger. The 16.0% increase in FY 2018 federal intramural R&D is mostly driven by a 22.4% increase from DOD and 17.5% from HHS (table 3). DOD R&D performance increased from $15.5 billion in FY 2017 (50.0% of all intramural obligations) to $19.0 billion in FY 2018 (52.8% of all intramural obligations). HHS increased from $7.1 billion in FY 2017 (22.8% of all intramural obligations) to $8.3 billion in FY 2018 (23.1% of all intramural obligations). The Department of Agriculture (USDA) was the third-largest funder of intramural research in FY 2018 at $1.6 billion in FY 2018 (4.3% of all intramural obligations), increasing 1.4% from $1.5 billion in FY 2017. The Department of Veterans Affairs reported total intramural funding of $1.3 billion, an 87.1% increase from FY 2017. However, this increase is the result of including research support services for intramural programs that had not been previously reported.
| Agency | Total R&D | Intramurala | Extramural | ||||||
|---|---|---|---|---|---|---|---|---|---|
| United States and U.S. territories | |||||||||
| Total | All FFRDCs | Industry | Universities and colleges |
Other nonprofits |
State, local governments |
Foreign | |||
na = not applicable; agency did not obligate funding to this type of performer. FFRDC = federally funded research and development center. a Intramural activities cover costs associated with the administration of intramural R&D programs and extramural R&D procurements by federal personnel as well as actual intramural performance. NOTE: Because of rounding, detail may not add to total. SOURCE: National Center for Science and Engineering Statistics, Survey of Federal Funds for Research and Development, FYs 2018–19. |
|||||||||
| All agencies | 8.8 | 16.0 | 6.2 | 6.5 | 5.0 | 8.9 | 3.8 | 1.5 | -5.6 |
| Selected departments | |||||||||
| Department of Agriculture | 2.5 | 1.4 | 4.3 | na | 9.0 | 4.2 | 3.8 | -4.7 | 18.5 |
| Department of Commerce | -10.8 | -12.5 | -6.1 | -29.4 | -20.1 | 9.4 | -55.2 | 10.4 | -64.9 |
| Department of Defense | 18.1 | 22.4 | 15.7 | 13.2 | 15.1 | 22.2 | 48.2 | 60.4 | -19.1 |
| Department of Energy | 4.3 | 9.4 | 3.7 | 3.9 | -8.3 | 27.5 | 8.1 | 113.0 | 0.0 |
| Department of Health and Human Services | 9.3 | 17.5 | 7.1 | -11.5 | 8.5 | 8.2 | 7.0 | -22.0 | -0.5 |
| Department of Homeland Security | 6.4 | -1.6 | 12.5 | -15.3 | 30.3 | -10.5 | -22.6 | -97.5 | 331.3 |
| Department of the Interior | -11.2 | -12.4 | -2.2 | 225.0 | -24.4 | -5.9 | -78.0 | 20.2 | 50.0 |
| Department of Transportation | 10.3 | -0.7 | 13.4 | -4.9 | 9.9 | 63.9 | 43.4 | 3.5 | na |
| Department of Veterans Affairs | 97.7 | 87.1 | na | na | na | na | na | na | na |
| Other agencies | |||||||||
| Environmental Protection Agency | -1.3 | -3.2 | 1.0 | na | 1.2 | -0.8 | na | na | -100.0 |
| National Aeronautics and Space Administration | -14.9 | -16.8 | -14.6 | 13.7 | -24.8 | -3.4 | 31.8 | -78.9 | 4.0 |
| National Science Foundation | 6.0 | 6.4 | 6.0 | 33.6 | 13.6 | 3.9 | 3.6 | 86.1 | 49.6 |
| Nuclear Regulatory Commission | 15.3 | 15.3 | 15.6 | 28.3 | -7.7 | -43.3 | 125.0 | na | -9.1 |
| Smithsonian Institution | 9.6 | 9.6 | na | na | na | na | na | na | na |
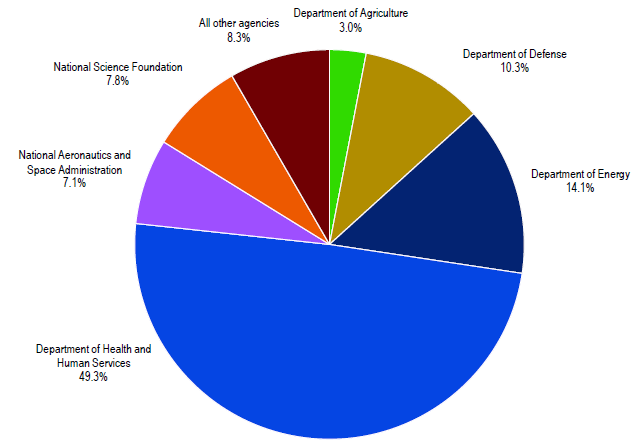
In FY 2018, federal obligations for research (including both basic research and applied research) accounted for 56.0% ($74.6 billion) of all federal R&D obligations; estimated FY 2019 research obligations increased to 57.1% of total R&D (table 1). HHS, which includes the National Institutes of Health (NIH), accounted for nearly half (49.3%) of all federal research obligations in FY 2018 with $36.8 billion (figure 1) (NIH accounted for $35.3 billion). DOE accounted for 14.1% ($10.5 billion) of the FY 2018 research total, followed by DOD with 10.3% ($7.7 billion), NSF with 7.8% ($5.8 billion), NASA with 7.1% ($5.3 billion), and USDA with 3.0% ($2.3 billion). Together these six agencies accounted for 91.7% ($68.4 billion) of all federal research obligations in FY 2018. Individual agency shares of basic research compared with applied research vary according to agency mission and objectives.
NOTE: Because of rounding, detail may not add to total.
SOURCE: National Center for Science and Engineering Statistics, Survey of Federal Funds for Research and Development, FYs 2018–19.
Federal obligations for basic research[3] increased 8.8%, from $33.3 billion in FY 2017 to $36.2 billion in FY 2018, while estimated obligations for FY 2019 showed further growth, increasing an additional 9.6% to $39.7 billion (table 1). In FY 2018, the six largest agencies accounted for 96.7% ($35.0 billion) of all federal obligations for basic research. Half (50.4%) of all federal obligations for basic research were made by HHS ($18.2 billion). NSF remains the second-largest funder of basic research in FY 2018 with 14.1% ($5.1 billion), while DOE is the third-largest funder of basic research, with a 13.8% share ($5.0 billion) of total obligations.
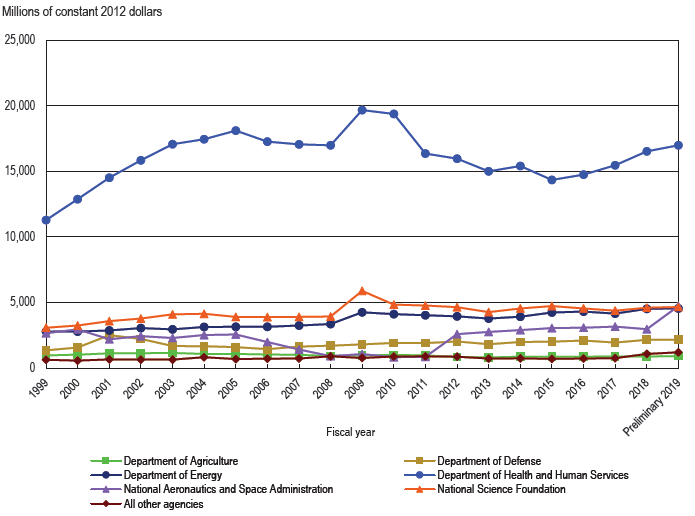
When adjusted for inflation[4], basic research obligations for all agencies increased 43.8% from FY 1999 to FY 2018 (figure 2). DOE's obligations for basic research increased 62.6% between FY 1999 and FY 2018, while DOD's increased 59.2% during the same period. USDA was the only agency that showed a decline (-8.1%) in constant dollars for basic research, from $972.5 million in FY 1999 to $894.1 million in FY 2018.
NOTES: Because of rounding, detail may not add to total. FYs 2009 and 2010 obligations include additional funding provided by the American Recovery and Reinvestment Act of 2009.
SOURCE: National Center for Science and Engineering Statistics, Survey of Federal Funds for Research and Development.
Federal obligations for applied research[5] increased 4.9% between FY 2017 and FY 2018, to $38.4 billion, while estimated obligations for FY 2019 showed a larger increase of 14.0% to $43.8 billion (table 1). Although the share of total applied research was not as concentrated as the share of basic research among the six largest R&D funding agencies, combined these agencies still accounted for 86.9% ($33.4 billion) of all applied research obligations in FY 2018. As with basic research, HHS still accounts for the largest share of applied research, with 48.3% ($18.6 billion) in FY 2018. DOE and DOD are the second- and third-largest funders of applied research in FY 2018, with 14.3% ($5.5 billion) and 13.7% ($5.3 billion), respectively.
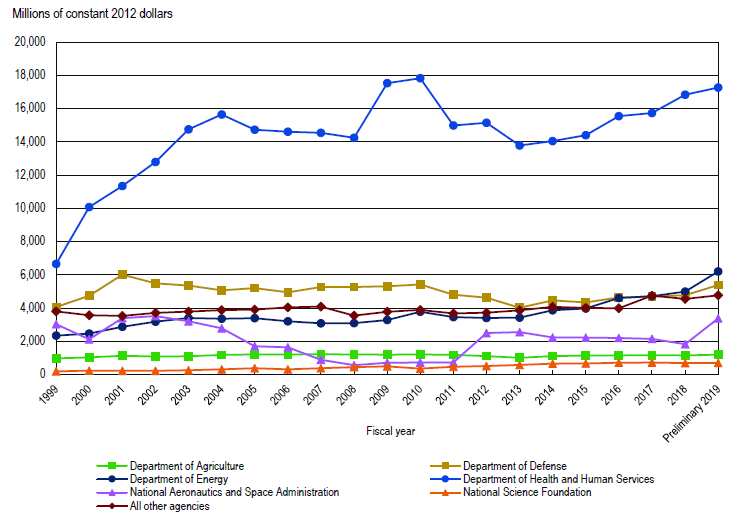
When adjusted for inflation, applied research obligations for all agencies increased 65.4% from FY 1999 to FY 2018 (figure 3). HHS saw the largest increase between FY 1999 and FY 2018 (153.1%), while DOE increased 113.4% during the same period.
NOTES: Because of rounding, detail may not add to total. FYs 2009 and 2010 obligations include additional funding provided by the American Recovery and Reinvestment Act of 2009.
SOURCE: National Center for Science and Engineering Statistics, Survey of Federal Funds for Research and Development.
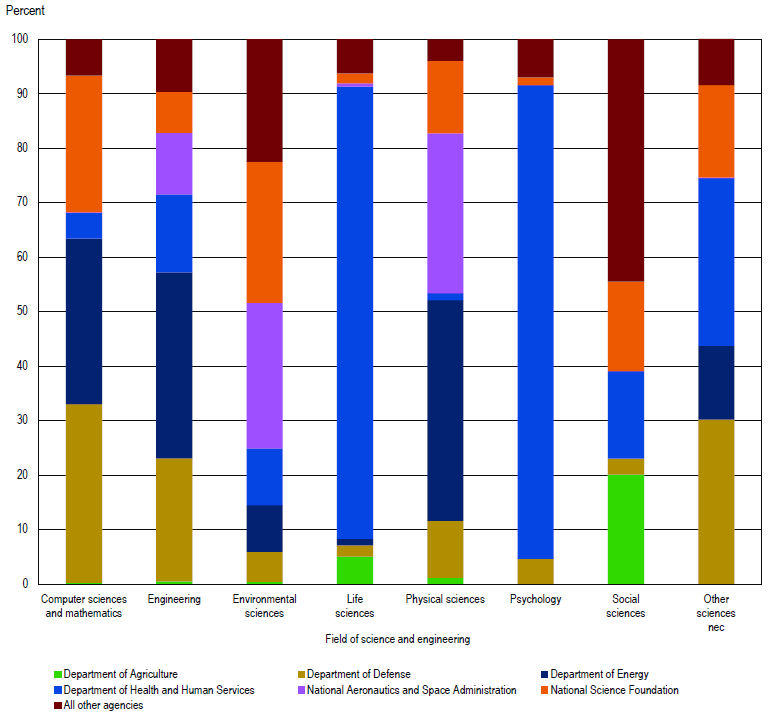
Among all fields of science and engineering, life sciences accounted for the largest share of all research obligations in FY 2018 (49.6%, or $37.0 billion out of $74.6 billion), but research obligations for life sciences are highly concentrated; HHS accounts for 83.0% ($30.7 billion) of this total (figure 4). Funding sources for computer sciences and mathematics are more diversified with 32.8% ($1.4 billion) of obligations in FY 2018 from DOD, 30.4% ($1.3 billion) from DOE, and 25.1% ($1.1 billion) from NSF. The largest share of funding for engineering comes from DOE (34.1%, or $4.7 billion) followed by DOD (22.6%, or $3.1 billion), HHS (14.3%, or $2.0 billion), and NASA (11.3%, or $1.5 billion). Physical sciences are largely funded by DOE (40.5%, or $3.2 billion) and NASA (29.3%, or $2.3 billion). Of all obligations for social sciences, USDA funded 20.1% ($208.9 million) and NSF funded 16.4% ($170.9 million).
NOTE: Because of rounding, detail may not add to total.
SOURCE: National Center for Science and Engineering Statistics, Survey of Federal Funds for Research and Development, FYs 2018–19.
Although DOD's share of obligations for research constituted 10.3% of total federal research obligations ($7.7 billion of $74.6 billion) in FY 2018, their share of obligations for experimental development[6] was much larger at 82.6% ($45.3 billion of the $54.8 billion total) (table 4). DOD's increasing share of all experimental development obligations since FY 2016 (77.2%) is driven by increases in major systems development, which increased 21.2% between FY 2016 and FY 2018, while advanced technology development increased 16.5% during the same period. DOD's estimated growth in advanced technology and major systems development continued in FY 2019, increasing 8.9% and 4.3%, respectively from FY 2018. In FY 2016 and FY 2017, NASA's experimental development obligations accounted for 13.9% of total experimental development before declining to 9.9% ($5.4 billion) in FY 2018. DOE had the third-largest amount of federal obligations for experimental development, although its share of the total has decreased from 5.6% and 5.5% in FY 2016 and FY 2017, respectively, to 4.2% and 4.3% for FYs 2018 and 2019, respectively.
| Agency | 2016 | 2017 | 2018 | Preliminary 2019 |
|---|---|---|---|---|
NA = not available; data were not collected for that fiscal year. NOTES: Because of rounding, detail may not add to total. Only those agencies and subdivisions that had obligations in variables represented by this table appear in the table. SOURCE: National Center for Science and Engineering Statistics, Survey of Federal Funds for Research and Development. |
||||
| All agencies | 48,728.1 | 49,103.5 | 54,837.2 | 58,058.1 |
| Departments | ||||
| Department of Agriculture | 201.9 | 202.1 | 222.0 | 199.3 |
| Department of Commerce | 198.0 | 310.2 | 209.9 | 220.9 |
| Department of Defense | 37,596.6 | 37,694.6 | 45,320.5 | 47,561.2 |
| Advanced technology | 5,467.2 | 5,707.6 | 6,367.4 | 6,935.3 |
| Major systems | 32,129.3 | 31,987.0 | 38,953.1 | 40,625.9 |
| Department of Education | 81.1 | 87.8 | 76.3 | 74.1 |
| Department of Energy | 2,743.3 | 2,723.9 | 2,324.1 | 2,496.1 |
| Department of Health and Human Services | 87.1 | 96.8 | 109.8 | 93.9 |
| Department of Homeland Security | 364.6 | 580.6 | 542.5 | 562.7 |
| Department of Housing and Urban Development | 23.9 | 22.7 | 21.6 | 0.0 |
| Department of the Interior | 130.6 | 140.7 | 116.0 | 126.2 |
| Department of Justice | 51.1 | 40.2 | 15.4 | 15.7 |
| Department of Labor | 3.9 | 0.0 | 0.0 | 0.0 |
| Department of Transportation | 311.8 | 253.0 | 295.1 | 368.5 |
| Department of the Treasury | 2.8 | 6.9 | 0.0 | 11.0 |
| Department of Veterans Affairs | 17.8 | 13.5 | 29.1 | 34.0 |
| Other agencies | ||||
| Agency for International Development | 44.3 | 0.0 | 46.2 | 46.2 |
| Environmental Protection Agency | 78.0 | 76.2 | 74.5 | 109.7 |
| Federal Communications Commission | 0.0 | 1.1 | 0.7 | 0.0 |
| Library of Congress | 0.7 | 1.0 | 2.5 | 1.7 |
| National Aeronautics and Space Administration | 6,790.6 | 6,849.4 | 5,423.6 | 6,129.0 |
| Tennessee Valley Authority | NA | 3.0 | 7.3 | 8.0 |
The survey is a census of all federal agencies that fund R&D programs, as identified from information in the president's budget submission to Congress, excluding the Central Intelligence Agency. Federal agencies that fund R&D are identified in the budget's Analytical Perspectives section and the detailed budget estimates by agency section of the appendix. Data were obtained from 32 federal agencies (15 federal departments and 17 independent agencies) that had obligations for R&D during FY 2018 or FY 2019. Because multiple subdivisions of some federal departments completed the survey, there were 82 agency-level responses: 5 federal departments, 60 agencies (within another 10 federal departments), and 17 independent agencies. The survey collects data on outlays for total R&D and R&D plant; obligations for R&D by type of R&D, by type of performer, and by state-area and foreign country; obligations for research by fields of science and engineering; and obligations for R&D plant.
Volume 68 of the Survey of Federal Funds for Research and Development collected final FY 2018 data and preliminary FY 2019 totals. FY 2019 data are subject to revision when collected under next year's survey, volume 69.
Beginning with volume 66 of the survey (FYs 2016 and 2017), the totals reported for development obligations and outlays represent a refinement to this category by more narrowly defining it to be "experimental development" to align with federal R&D budget formulation as per the Office of Management and Budget's Circular A-11, Section 84. As a result, totals for experimental development do not include the DOD Budget Activity 7 (Operational Systems Development) obligations and outlays. Those funds, previously included in DOD's development totals, support the development efforts to upgrade systems that have been fielded or have received approval for full-rate production and anticipate production funding in the current or subsequent fiscal year. Therefore, the development data and total R&D data are not directly comparable with totals reported prior to FY 2016.
The full set of detailed statistical tables for FYs 2018 and 2019 will be available at https://www.nsf.gov/statistics/srvystaterd/. Individual tables may be available in advance of the full report. For more information, please contact the author.
[1] Christopher Pece, Research and Development Statistics Program, National Center for Science and Engineering Statistics, National Science Foundation, 2415 Eisenhower Avenue, Suite W14200, Alexandria, VA 22314 (cpece@nsf.gov; 703-292-7788).
[2] Obligations represent the amount for orders placed, contracts awarded, services received, and similar transactions during a given period, regardless of when the funds were appropriated or when future payment of money is required. This includes funds from direct appropriations, trust funds, special accounts, fees and charges, and other federal sources for the year of the obligation. Obligations include the full cost of R&D, both specific project costs and overhead costs. Interagency transfers for R&D are reported as R&D or R&D plant by the transferring agency, not by the agency receiving the funds.
[3] Basic research is experimental or theoretical work undertaken primarily to acquire new knowledge of the underlying foundations of phenomena and observable facts. Basic research may include activities with broad or general applications in mind, such as the study of how plant genomes change, but it should exclude research directed toward a specific application or requirement, such as the optimization of the genome of a specific crop species. Details on basic research obligations by agency are available in table 27 in the full set of data tables.
[4] Gross domestic product implicit price deflators were used to convert current to constant 2012 dollars. Data on federal fiscal year, historical figures, 1953–2018 can be found in Office of Management and Budget. 2019. Budget of the U.S. Government, Fiscal Year 2020. Historical Tables (table 10.1). Available at https://www.govinfo.gov/features/budget-fy2020. Data on projections, 2019–21 can be found in Office of Management and Budget. 2019. Economic assumptions and Overview. In Analytical Perspectives, Budget of the U.S. Government, Fiscal Year 2020. Available at https://www.whitehouse.gov/wp-content/uploads/2019/03/spec-fy2020.pdf.
[5] Applied research is original investigation undertaken to acquire new knowledge. Applied research is, however, directed primarily toward a specific practical aim or objective. Details on applied research obligations by agency are available in table 39 in the full set of data tables.
[6] Experimental development is creative and systematic work, drawing on knowledge gained from research and practical experience, which is directed at producing new products or processes or improving existing products or processes. Like research, experimental development will result in gaining additional knowledge. This includes the production of materials, devices, and systems or methods, including the design, construction, and testing of experimental prototypes, as well as technology demonstrations, in cases where a system or component is being demonstrated at scale for the first time and where it is realistic to expect additional refinements to the design (feedback R&D) following the demonstration.