Purpose. The National Survey of College Graduates (NSCG), conducted by the National Center for Science and Engineering Statistics (NCSES) within the National Science Foundation (NSF), provides data on the characteristics of the nation's college graduates, with a focus on those in the science and engineering workforce. It samples individuals who are living in the United States during the survey reference week, have at least a bachelor's degree, and are younger than 76. By surveying college graduates in all academic disciplines, the NSCG provides data useful in understanding the relationship between college education and career opportunities, as well as the relationship between degree field and occupation.
The NSCG is designed to provide demographic, education, and career history information about college graduates and to complement another survey conducted by NCSES: the Survey of Doctorate Recipients (SDR, https://www.nsf.gov/statistics/srvydoctoratework/). These two surveys share a common reference date, and they use similar questionnaires and data processing guidelines.
Data collection authority. The information collected in the NSCG is solicited under the authority of the NSF Act of 1950, as amended, and the America COMPETES Reauthorization Act of 2010. In accordance with an interagency agreement, the U.S. Census Bureau collects the NSCG data under the authority of Title 13, Section 8, of the United States Code. The Office of Management and Budget control number is 3145-0141, with an expiration date of 29 February 2020.
Survey sponsor. NCSES.
Frequency. Biennial.
Initial survey year. 1993.
Reference period. The week of 1 February 2017.
Response unit. Individuals with a bachelor's degree or higher.
Sample or census. Sample.
Population size. Approximately 61.2 million individuals.
Sample size. Approximately 124,000 individuals.
Target population. The NSCG target population includes individuals who meet all of the following criteria:
Sampling frame. Using a rotating panel design, the NSCG includes new sample cases from the 2015 American Community Survey (ACS) and returning sample cases from the 2015 NSCG.
The NSCG sampling frame for new sample cases included the following eligibility requirements:
Returning sample cases from the 2015 NSCG originated from three different frames (the 2009 ACS, 2011 ACS, and 2013 ACS) and had the following eligibility requirements:
Sample design. The NSCG sample design is cross-sectional with a panel element. As a cross-sectional study, the NSCG provides estimates of the size and characteristics of the college graduate population for a point in time. The panel element of the design consists of the follow-up surveys conducted every two or three years after the first survey year.
The NSCG uses a stratified sampling design to select its sample from the eligible sampling frame.
In the new sample, cases in the science and engineering (S&E) strata were selected using systematic sampling, and cases in the non-S&E strata were selected with probability proportional to size (PPS) sampling. Among the returning sample, all eligible cases were selected. The sampling strata were defined by the cross classification of the following four variables:
As was the case in the 2015 NSCG, the 2017 NSCG includes an oversample of young graduates to improve the precision of estimates for this important population.
Data collection. The data collection period lasted approximately 6 months (17 April 2017–29 October 2017). The NSCG used a trimodal data collection approach: self-administered online survey (Web), self-administered paper questionnaire (mail), and computer-assisted telephone interview (CATI). Individuals in the sample were started in one mode depending on their past preference and available contact information. After an initial survey invitation, the data collection protocol included sequential contacts by postal mail, e-mail, and telephone that ran throughout the data collection period. At any time during data collection, sample members could choose to complete the survey using any of the three modes. Nonrespondents to the initial survey invitation received follow-up with alternate survey modes.
Quality assurance procedures were in place at each data collection step (e.g., address updating, printing, package assembly and mailing, questionnaire receipt, data entry, coding, CATI, and post-data collection processing).
Mode. About 79% of the participants completed the survey by Web, 12% by mail, and 9% by CATI.
Response rates. Response rates were calculated on complete responses, that is, from instruments with responses to all critical items. Critical items are those containing information needed to report labor force participation (including employment status, job title, and job description), college education (including degree type, degree date, and field of study), and location of residency on the reference date. There were 83,672 complete questionnaires. The overall unweighted response rate was 70%; the weighted response rate was 71%.
Data editing. Complete case data were captured and edited under the three separate data collection modes for the 2017 NSCG. The Web survey captured most of the survey responses and had internal editing controls where appropriate. A computer-assisted data entry (CADE) system was used to process the mail paper forms. Complete responses from the three separate modes were merged for subsequent coding, editing, and cleaning necessary to create an analytical database.
Following established NCSES guidelines for coding NSCG survey data, including verbatim responses, staff were trained in conducting a standardized review and coding of occupation and education information, certifications, "other/specify" verbatim responses, state and country geographical information, and postsecondary institution information. For standardized coding of occupation (including auto-coding), the respondent's reported job title, duties and responsibilities, and other work-related information from the questionnaire were reviewed by specially trained coders who corrected known respondent self-reporting errors to obtain the best occupation codes. For standardized coding of field of study associated with any reported degree (including auto-coding), the respondent's reported department, degree level, and field of study information from the questionnaire were reviewed by specially trained coders who corrected known respondent self-reporting errors to obtain the best field of study codes.
Imputation. Logical imputation was primarily accomplished as part of editing. In the editing phase, the answer to a question with missing data was sometimes determined by the answer to another question. In some circumstances, editing procedures found inconsistent data that were blanked out and therefore subject to statistical imputation.
The item nonresponse rates reflect data missing after logical imputation or editing but before statistical imputation. For key employment items—such as employment status, sector of employment, and primary work activity—the item nonresponse rates ranged from 0.00% to 1.07%. Nonresponse to questions deemed sensitive was higher: nonresponse to salary and earned income was 4.54% and 6.30%, respectively, for the new sample members and 5.33% and 7.43%, respectively, for the returning members. Personal demographic data of the new sample members had variable item nonresponse rates, with sex at 0.00%, birth year at 0.02%, marital status at 0.24%, citizenship at 0.13%, ethnicity at 0.92%, and race at 2.33%. The nonresponse rates for returning sample members were 1.52% for marital status and 1.41% for citizenship.
Item nonresponse was typically addressed using statistical imputation methods. Most NSCG variables were subjected to hot deck imputation, with each variable having its own class and sort variables chosen by regression modeling to identify nearest neighbors for imputed information. For some variables, there was no set of class and sort variables that was reliably related to or suitable for predicting the missing value, such as day of birth. In these instances, random imputation was used, so that the distribution of imputed values was similar to the distribution of reported values without using class or sort variables.
Imputation was not performed on critical items or on verbatim-based variables. In addition, for some missing demographic information, the NSCG imported the corresponding data from the ACS, which had performed its own imputation.
Weighting. Because the NSCG is based on a complex sampling design and subject to nonresponse bias, sampling weights were created for each respondent to support unbiased population estimates. The final analysis weights account for several factors, including the following:
The final sample weights enable data users to derive survey-based estimates of the NSCG target population. The variable name on the NSCG public use data files for the NSCG final sample weight is WTSURVY. More detailed information on weighting is contained in the 2017 NSCG Methodology Report.
Variance estimation. The successive difference replication method (SDRM) was used to develop replicate weights for variance estimation. The theoretical basis for the SDRM is described in Wolter (1984) and in Fay and Train (1995). As with any replication method, successive difference replication involves constructing a number of subsamples (replicates) from the full sample and computing the statistic of interest for each replicate. The mean square error of the replicate estimates around their corresponding full sample estimate provides an estimate of the sampling variance of the statistic of interest. The 2017 NSCG produced 320 sets of replicate weights. Please contact the NSCG Project Officer to obtain the NSCG replicate weights and the replicate weight user guide.
Disclosure protection. To protect against the disclosure of confidential information provided by NSCG respondents, the estimates presented in NSCG data tables are rounded to the nearest 1,000. Percentages were calculated based on unrounded estimates.
Data table cell values based on counts of respondents that fall below a predetermined threshold are deemed to be sensitive to potential disclosure, and the letter "D" indicates this type of suppression in a table cell.
Sampling error. NSCG estimates are subject to sampling errors. Estimates of sampling errors associated with this survey were calculated using replicate weights and are included in each table of estimates. Data table estimates with coefficients of variation (that is, the estimate divided by the standard error) that exceed a predetermined threshold are deemed unreliable and are suppressed. The letter "S" indicates this type of suppression in a table cell.
Coverage error. Coverage error occurs in sample estimates when the sampling frame does not accurately represent the target population and is a type of nonsampling error. Any missed housing units or missed individuals within sample households in the ACS would create undercoverage in the NSCG. Additional undercoverage errors may exist because of self-reporting errors in the NSCG sampling frame that led to incorrect classification of individuals as not having a bachelor's degree or higher when in fact they held such a degree.
Nonresponse error. The weighted response rate for the 2017 NSCG was 71%; the unweighted response rate was 70%. Analyses of NSCG nonresponse trends were used to develop nonresponse weighting adjustments to minimize the potential for nonresponse bias in the NSCG estimates. A hot deck imputation method was used to compensate for item nonresponse.
Measurement error. The NSCG is subject to reporting errors from differences in interpretation of questions and by modality (Web, mail, CATI). To reduce measurement errors, the NSCG questionnaire items were pretested in focus groups and cognitive interviews.
Data comparability. Year-to-year comparisons of the nation's college-educated population can be made among the 1993, 2003, 2010, 2013, 2015, and 2017 survey cycles because many of the core questions remained the same. Because the 1995, 1997, 1999, 2006, and 2008 surveys do not provide full coverage of the nation's college-educated population, any comparison between these cycles and other cycles should be limited to those individuals educated or employed in S&E fields.
Small but notable differences exist across some survey cycles, however, such as the collection of occupation and education data based on more recent taxonomies. Also, because of the use of different reference months in some survey cycles, seasonal differences may occur when making comparisons across years. Thus, use caution when interpreting cross-cycle comparisons.
There is overlap in the cases included in the 2010, 2013, 2015, and 2017 NSCG. This sample overlap consists of cases that originated in the 2009, 2011, or 2013 ACS. The overlap among cases allows for the ability to conduct longitudinal analysis of this subset of the NSCG sample. To link cases on the NSCG public use data files across survey years 2010, 2013, or 2015, the REFID (reference identifier) unique identification variable can be used. To aid in this longitudinal analysis, single-frame weights are available for each survey year that allow for the evaluation of estimates from each frame independently. Please contact the NSCG Project Officer to obtain the single-frame weights.
To reduce the risk of disclosure of confidential information, the REFID variable is not included in the 2017 NSCG public use file. Hence, it is not possible to link 2017 NSCG data to prior survey years. In place of REFID, the OBSNUM (observation number) variable was added to the 2017 NSCG public use file to serve as a single-cycle case identifier.
Changes in survey coverage and population.
Approximately 76,000 cases were selected from the returning sample members, who originated in the 2009, 2011, or 2013 ACS. These returning sample members were included for one of the three biennial follow-up interviews that are part of the rotating panel design. For the baseline survey interview, about 48,000 new sample cases were selected from the 2015 ACS.
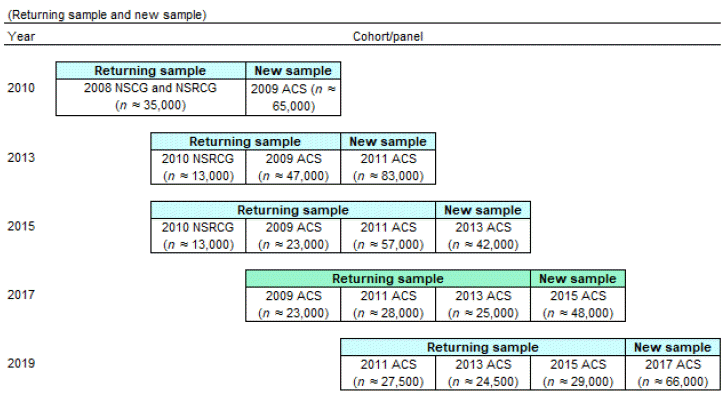
NSCG = National Survey of College Graduates; NSRCG = National Survey of Recent College Graduates; ACS = American Community Survey
Note(s):
During a panel's second survey cycle (in which it is part of the returning sample for the first time), its members include individuals who responded or who were temporarily ineligible during the first cycle. During a panel's third and fourth cycles, its members include all respondents, nonrespondents, and temporarily ineligible cases from the preceding cycle. Beginning in 2013, the NSCG transitioned to a design that includes an oversample of young graduates to improve the precision of estimates for this important population
Source(s):
National Center for Science and Engineering Statistics, National Science Foundation, National Survey of College Graduates
Changes in questionnaire.
Changes in reporting procedures.
Changes in microdata.
Full-time and part-time employment. Full-time (working 35 hours or more per week) and part-time (working less than 35 hours per week) employment status is for the principal job only and not for all jobs held in the labor force. For example, an individual could work part time in his or her principal job but full time in the labor force.
Occupation data. The occupational classification of the respondent was based on his or her principal job (including job title) held during the reference week—or on his or her last job held, if not employed in the reference week (survey questions A5 and A6 as well as A16 and A17). Also used in the occupational classification was a respondent-selected job code (survey questions A7 and A18). (See table A-1 for a list and classification of occupations reported in the NSCG.)
Race and ethnicity. Ethnicity is defined as Hispanic or Latino or not Hispanic or Latino. Values for those selecting a single race include American Indian or Alaska Native, Asian, black or African American, Native Hawaiian or Other Pacific Islander, and white. Those persons who report more than one race and who are not of Hispanic or Latino ethnicity also have a separate value.
Salary. Median annual salaries are reported for the principal job, rounded to the nearest $1,000, and computed for full-time employed scientists and engineers. For individuals employed by educational institutions, no accommodation was made to convert academic year salaries to calendar year salaries.
Sector of employment. Employment sector is a derived variable based on responses to questionnaire items A13, A14, and A15. In the data tables, the category 4-year educational institutions includes 4-year colleges or universities, medical schools (including university-affiliated hospitals or medical centers), and university-affiliated research institutes. Other educational institutions include 2-year colleges, community colleges, technical institutes, precollege institutions, and other educational institutions (which respondents reported verbatim in the survey questionnaire). Private, for-profit includes respondents who were self-employed in an incorporated business. Self-employed includes respondents who were self-employed or were a business owner in a non-incorporated business.
Underrepresented minority. This category comprises three racial or ethnic minority groups (blacks or African Americans, Hispanics or Latinos, and American Indians or Alaska Natives) whose representation in S&E education or employment is smaller than their representation in the U.S. population.
| Table | Title | Excel | |
|---|---|---|---|
| A-1 | Crosswalk of occupations used in the National Survey of College Graduates | View Excel | View PDF |
[1] National Research Council. (2008). Using the American Community Survey for the National Science Foundation's Science and Engineering Workforce Statistics Programs. Panel on Assessing the Benefits of the American Community Survey for the NSF Division of Science Resources Statistics, Committee on National Statistics, Division of Behavioral and Social Sciences and Education. Washington, DC: The National Academies Press.