

Field of study
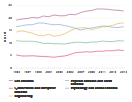
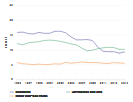
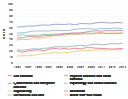
Women's share of doctorates awarded has grown over the past 2 decades in all broad fields of study. In 2015, women earned the majority of doctorates awarded in every broad field of study except physical and earth sciences, mathematics and computer sciences, and engineering.
Although women earned only about one-third of the 2015 doctorates awarded in physical and earth sciences and less than one-fourth of the doctorates in engineering, their relative shares of doctorates awarded in those fields has been growing rapidly. From 2005 to 2015, the proportion of doctorates in physical and earth sciences awarded to women increased by 6 percentage points, and the share of women in engineering grew by 5 percentage points. The proportion of female doctorate recipients in mathematics and computer sciences has grown more modestly, by 1 percentage point from 2005 to 2015 (figure E).
Doctorates awarded to women, by broad field of study: 1995–2015

| Year | All fields | Life sciences | Physical sciences and earth sciences | Mathematics and computer sciences | Psychology and social sciences | Engineering | Education | Humanities and arts | Other non-S&E fields |
|---|---|---|---|---|---|---|---|---|---|
| 1995 | 39.5 | 42.2 | 22.6 | 20.7 | 51.1 | 11.7 | 61.6 | 46.5 | 39.3 |
| 1996 | 40.1 | 43.5 | 21.9 | 18.3 | 51.7 | 12.4 | 61.9 | 48.4 | 40.6 |
| 1997 | 40.9 | 44.9 | 22.8 | 20.6 | 52.9 | 12.4 | 63.3 | 46.7 | 39.9 |
| 1998 | 42.0 | 45.5 | 24.5 | 21.8 | 54.5 | 13.1 | 63.0 | 47.7 | 43.0 |
| 1999 | 42.7 | 44.6 | 23.7 | 22.5 | 54.7 | 14.9 | 64.2 | 47.4 | 42.3 |
| 2000 | 43.9 | 47.0 | 25.2 | 21.0 | 54.7 | 15.8 | 64.9 | 49.0 | 43.5 |
| 2001 | 44.0 | 47.1 | 25.5 | 23.4 | 54.7 | 16.9 | 64.6 | 48.8 | 44.8 |
| 2002 | 45.4 | 47.5 | 27.4 | 25.1 | 55.4 | 17.6 | 66.2 | 49.4 | 46.8 |
| 2003 | 45.4 | 48.3 | 27.8 | 23.7 | 55.7 | 17.3 | 66.1 | 49.5 | 46.3 |
| 2004 | 45.5 | 49.5 | 27.4 | 24.9 | 55.4 | 17.7 | 65.9 | 50.9 | 47.3 |
| 2005 | 45.2 | 50.9 | 27.9 | 23.5 | 55.8 | 18.4 | 66.8 | 49.8 | 49.6 |
| 2006 | 45.1 | 51.6 | 29.1 | 25.3 | 57.5 | 20.2 | 65.2 | 49.7 | 48.6 |
| 2007 | 45.5 | 51.4 | 30.4 | 24.1 | 58.6 | 20.7 | 67.4 | 48.8 | 51.5 |
| 2008 | 46.1 | 52.9 | 29.1 | 26.1 | 58.5 | 21.5 | 67.1 | 51.3 | 49.8 |
| 2009 | 46.8 | 54.5 | 31.4 | 26.3 | 58.5 | 21.4 | 66.9 | 51.0 | 49.4 |
| 2010 | 46.8 | 54.9 | 32.3 | 25.3 | 57.4 | 23.0 | 68.6 | 50.9 | 51.4 |
| 2011 | 46.4 | 54.5 | 31.1 | 24.9 | 59.5 | 22.2 | 69.3 | 50.8 | 52.2 |
| 2012 | 46.2 | 55.4 | 31.9 | 24.5 | 58.4 | 22.3 | 68.7 | 50.7 | 50.2 |
| 2013 | 46.2 | 55.0 | 33.4 | 23.7 | 59.2 | 22.8 | 68.2 | 50.5 | 51.1 |
| 2014 | 46.1 | 55.7 | 32.7 | 24.3 | 59.8 | 22.8 | 69.3 | 50.0 | 51.3 |
| 2015 | 46.2 | 55.4 | 33.6 | 24.7 | 58.6 | 23.2 | 68.5 | 50.6 | 51.7 |
S&E = science and engineering.
NOTE: Percentages are based on the number of doctorate recipients for whom sex was reported.
- SOURCE: Doctorate Recipients from U.S. Universities 2015. Related detailed data: tables 14, 15, 16.