Directorate for Social, Behavioral
and Economic Sciences
NSF 99-351 June 18, 1999
Rausch
Biotechnology: Genetic Engineering

The United States is widely considered the global leader in the biotechnology field and an examination of U.S. patenting in genetic engineering technologies during 1990-94 supports that perception.
The United States produced 63 percent of the internationally patented genetic engineering families formed during the period examined—nearly five times that produced by Japan and six times that produced by the United Kingdom.
This report is the second in a three-part series that examines America’s technological position vis-à-vis that of five other countries—Japan, Germany, France, the United Kingdom, and South Korea—in high-tech areas likely to be important to future economic competitiveness. The areas examined are advanced manufacturing, biotechnology, and advanced materials. The indicator used to determine a country’s relative strength and interest in these areas is international patent activity. To facilitate patent search and analysis, the three broad areas are each represented by a narrower subfield. This report examines genetic engineering technologies as a proxy for biotechnology.[1]
International Patenting Activity
Tabulated by priority year, this indicator provides a first measure of the extent and growth of each nation’s inventive activity. These patent family counts represent inventions important enough to be patented outside of the country of origin. During the first half of the 1990s, 3,411 international patent families were formed in genetic engineering with priority applications in the six countries examined; the largest increase in number of families was recorded in 1993 (figure 1). Patenting activity in this six-country group accounts for over 85 percent of all families in this technology area.

The United States is widely considered the global leader in the biotechnology field, and these data support that perception. The United States is the priority country (that is, the location of first application) for 63 percent of the international patent families examined here; Japan follows with 13 percent, the United Kingdom with 10 percent, and Germany with 7 percent.
|
As used here, genetic engineering is defined as recombinant DNA (rDNA) technology. It includes processes for isolation, preparation, or purification of DNA or RNA; DNA or RNA fragments and modified forms thereof; the introduction of foreign genetic material using vectors; vectors; use of hosts; and expression. It excludes monoclonal antibody technology. The analysis is built around the concept of a patent family, which consists of all the patent documents published in different countries associated with a single invention. The first application filed anywhere in the world is the priority application: it is assumed that the country in which the priority application was filed is the country in which the invention was developed. Similarly, the priority year is the year the priority application was filed. The basic patent is the first patent or patent application published in any of the roughly 40 countries covered in the database used (the Derwent World Patents Index Database). International patent families are used to mitigate bias introduced by national systems, such as Japan’s, that encourage large numbers of domestic patent applications. An international patent family is created when patent protection is sought in at least one other country besides that in which the earliest priority application was filed. The three indicators used in this assessment are overall trends in international inventive activity, highly cited inventions, and the size of international patent families. |
Highly Cited Genetic Engineering Inventions
Interpatent citations are an accepted method of gauging the technological value or significance of different patents. These citations, provided by the patent examiner, indicate the “prior art”—the technology in related fields of invention taken into account in judging the novelty of the present invention. The number of citations a patent receives from later patents can serve as an indicator of its technical importance or value. In fact, Carpenter, Narin, and Woolf (1981) have shown that, on average, technologically important U.S. patents receive twice as many examiner citations as does the average U.S. patent, reinforcing the validity of interpatent citation as an indicator of patent quality.
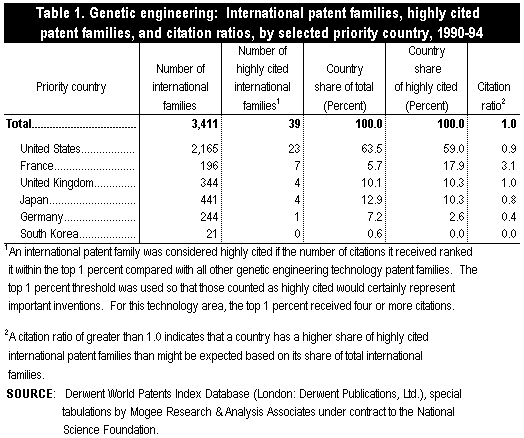
Of the 3,411 international patent families in genetic engineering formed by the six countries during the 1990-94 period, 39 were considered highly cited inventions.[2] The United States, which, as noted above, had the majority of the total international patent families recorded during the period, also had the largest proportion of those that were highly cited—59 percent (table 1). Japan had 10 percent of the highly cited international patent families.

Only France exceeded a proportionate share on this indicator. With far fewer patent families overall than the other countries examined, France produced more than three times the number of important, that is highly cited, patents as expected based on its level of activity. The United States, Japan, and Germany produced fewer highly cited patents than might be expected based on their shares of patent families associated with this technology, although the United States and Japan came close. South Korea did not produce any highly cited international patents. The United Kingdom’s share of highly cited patents matched its share of total genetic engineering inventions patented internationally (that is, its citation ratio equals 1.0).
Based on this indicator, the United States leads the other countries in terms of the volume of important (highly cited) genetic engineering inventions it produced during the period examined. While it fell slightly short (citation ratio of 0.9) of what might be expected given its share of overall patenting in this technology, the total number of highly cited patents produced by the United States in this important technology area is nonetheless noteworthy.
Average International Patent Family Size
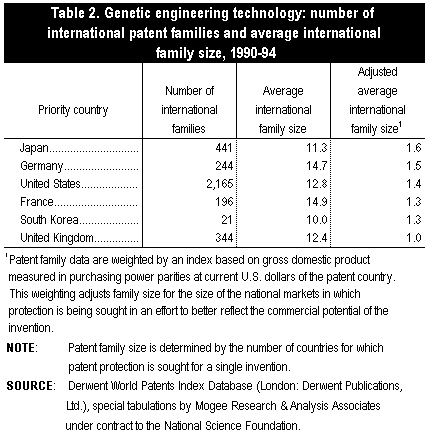
Given the significant costs associated with obtaining patent protection in multiple countries, this indicator attempts to measure the perceived economic potential of an invention by calculating the number of countries in which patent protection is being sought, adjusted for market size.[3]
Based on this measure, patented genetic engineering inventions developed in Japan and Germany appear to be the most commercially valuable on average, although the scores for each country are very similar (table 2). On average, Japan has sought patent protection in 11 countries whose combined economies are equivalent to 1.6 times that of the United States (as based on GDP); German-origin inventions average 14.7 countries with a combined GDP equal to 1.5 times that of the United States. Patented genetic engineering inventions originating in the United States rank third in perceived commercial exploitation potential. Inventions originating in France, South Korea, and the United Kingdom all trailed the three leaders based on this measure.

Summary of U.S. Position
Based on this examination of international patenting in genetic engineering technologies during 1990-94, the U.S. science and technology enterprise emerges as the leading producer of inventions in this key technology area. The United States produced 63 percent of the internationally patented genetic engineering inventions created during the period examined—nearly five times that produced by Japan and six times that produced by the United Kingdom. The United States also produced the largest number of highly cited genetic engineering inventions, although it fell slightly short of what might be expected given its share of overall patenting in this technology. Of the six countries studied, however, only France exceeded expectations on this measure. Interestingly, the “indexed” economic value of U.S. genetic engineering inventions trailed those of Japan and Germany, although scores on this indicator were generally close.
References
Carpenter, M.P., F. Narin, and P. Woolf. 1981. “Citation Rates to Technologically Important Patents.” World Patent Information 1981: 160-63.
Claus, P., and P.A. Higham. 1982. “Study of Citations Given in Search Reports of International Patent Applications Published Under the Patent Cooperation Treaty.” World Patent Information 4: 105-9.
Mogee, M. E. 1991. Technology Policy and Critical Technologies: A Summary of Recent Reports. Washington, D.C.: National Academy Press.
Mogee Research & Analysis Associates. 1997. Comparing Assessments of National Position in Key Science & Technology Fields. Report prepared under National Science Foundation SGER Grant No. SRS-9618668. Washington, DC.
Narin, F., K. Hamilton, and D. Olivastro. 1997. “The Increasing Linkage Between U.S. Technology and Public Science.” Research Policy 26, No. 3 (December): 317-30.
National Critical Technologies Review Group. March 1995. National Critical Technologies Report. Washington, DC.
Office of Science and Technology Policy (OSTP). 1995. National Critical Technologies Report. Washington, DC: National Critical Technologies Panel.
———. 1997. Science & Technology Shaping the Twenty-First Century. Washington, DC: Executive Office of the President.
Popper, S., C. Wagner, and E. Larson. 1998. New Forces at Work: Industry Views Critical Technologies. Santa Monica, CA: RAND.
This Issue Brief was prepared by:
Lawrence M. Rausch
Division of Science Resources Studies
National Science Foundation
4201 Wilson Boulevard, Suite 965
Arlington, VA 22230
703-306-1773 ext. 6927
E-mail: lrausch@nsf.gov
SRS data are available through the World Wide Web (http://www.nsf.gov/statistics/). For more information about obtaining reports, contact pubs@nsf.gov. or call (301) 947-2722. For NSF's Telephonic Device for the Deaf, dial (703) 306-0090. In your request, include the NSF publication number and title, your name, and a complete mailing address.