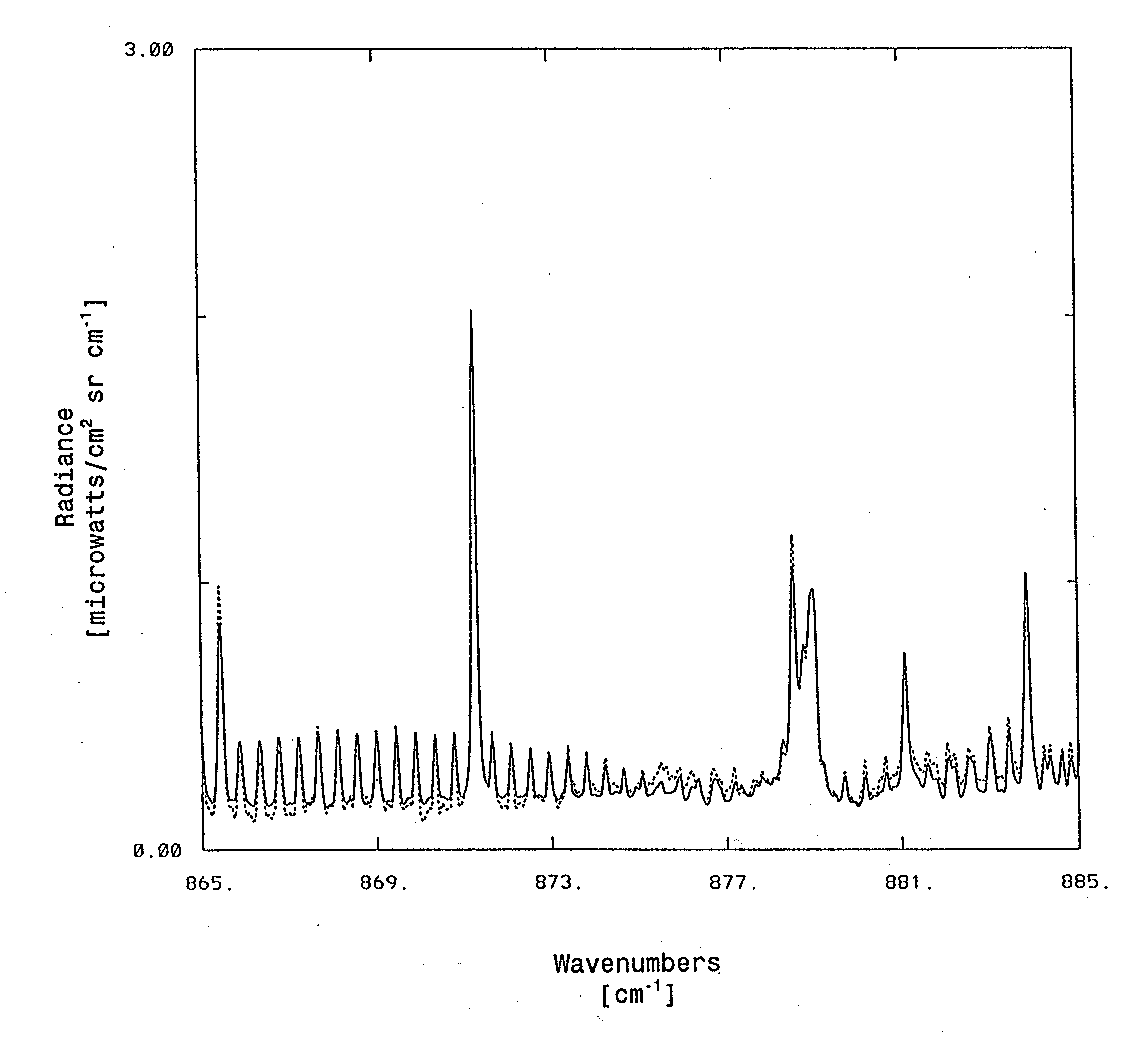
Figure from High-resolution infrared spectroscopy at South Pole and McMurdo Stations
Return to the article from which this figure is taken.

|
| Figure 1. Clear-sky emission spectrum from the South Pole on 26 February 1996, taken at 82.5 zenith angle. Expanded view of the 12-micron window, showing emission lines of nitric acid (HNO3) and water vapor (H2O). Solid line: calculated spectrum. Dashed line: measured spectrum. |