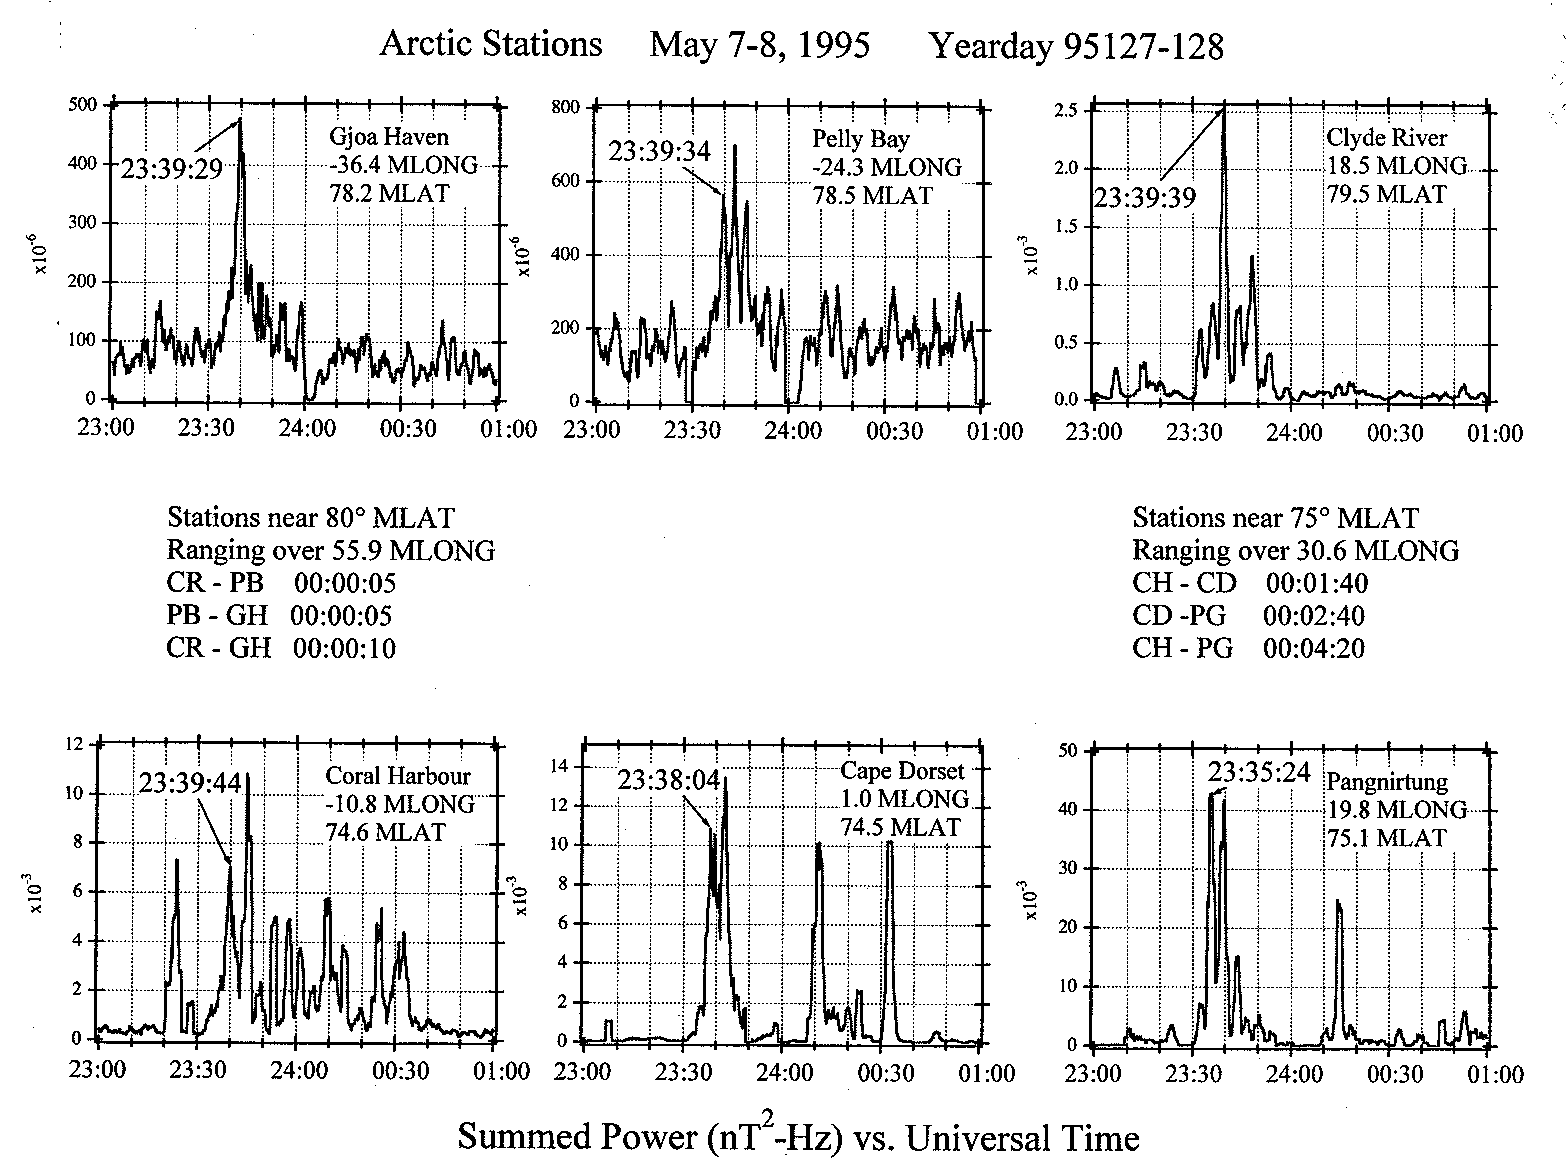
Figure from Multistation and conjugate observations of ultra-low-frequency substorm signatures at very high latitudes
Return to the article from which this figure is taken.

|
| Figure 2. Graphs as in figure 1 showing the data from Arctic MACCS stations. The Pi 1 bursts seen at the MACCS stations near 80 MLAT occur within 10 seconds of one another. These 80 stations range over 55.9 of magnetic longitude. The bursts at the 75 stations, ranging over 30.6 of longitude, occur over a much larger scale with a delay on the order of 1-4 minutes. (MLONG denotes magnetic longitude. nT2-Hz denotes nanoteslas squared-hertz.) |