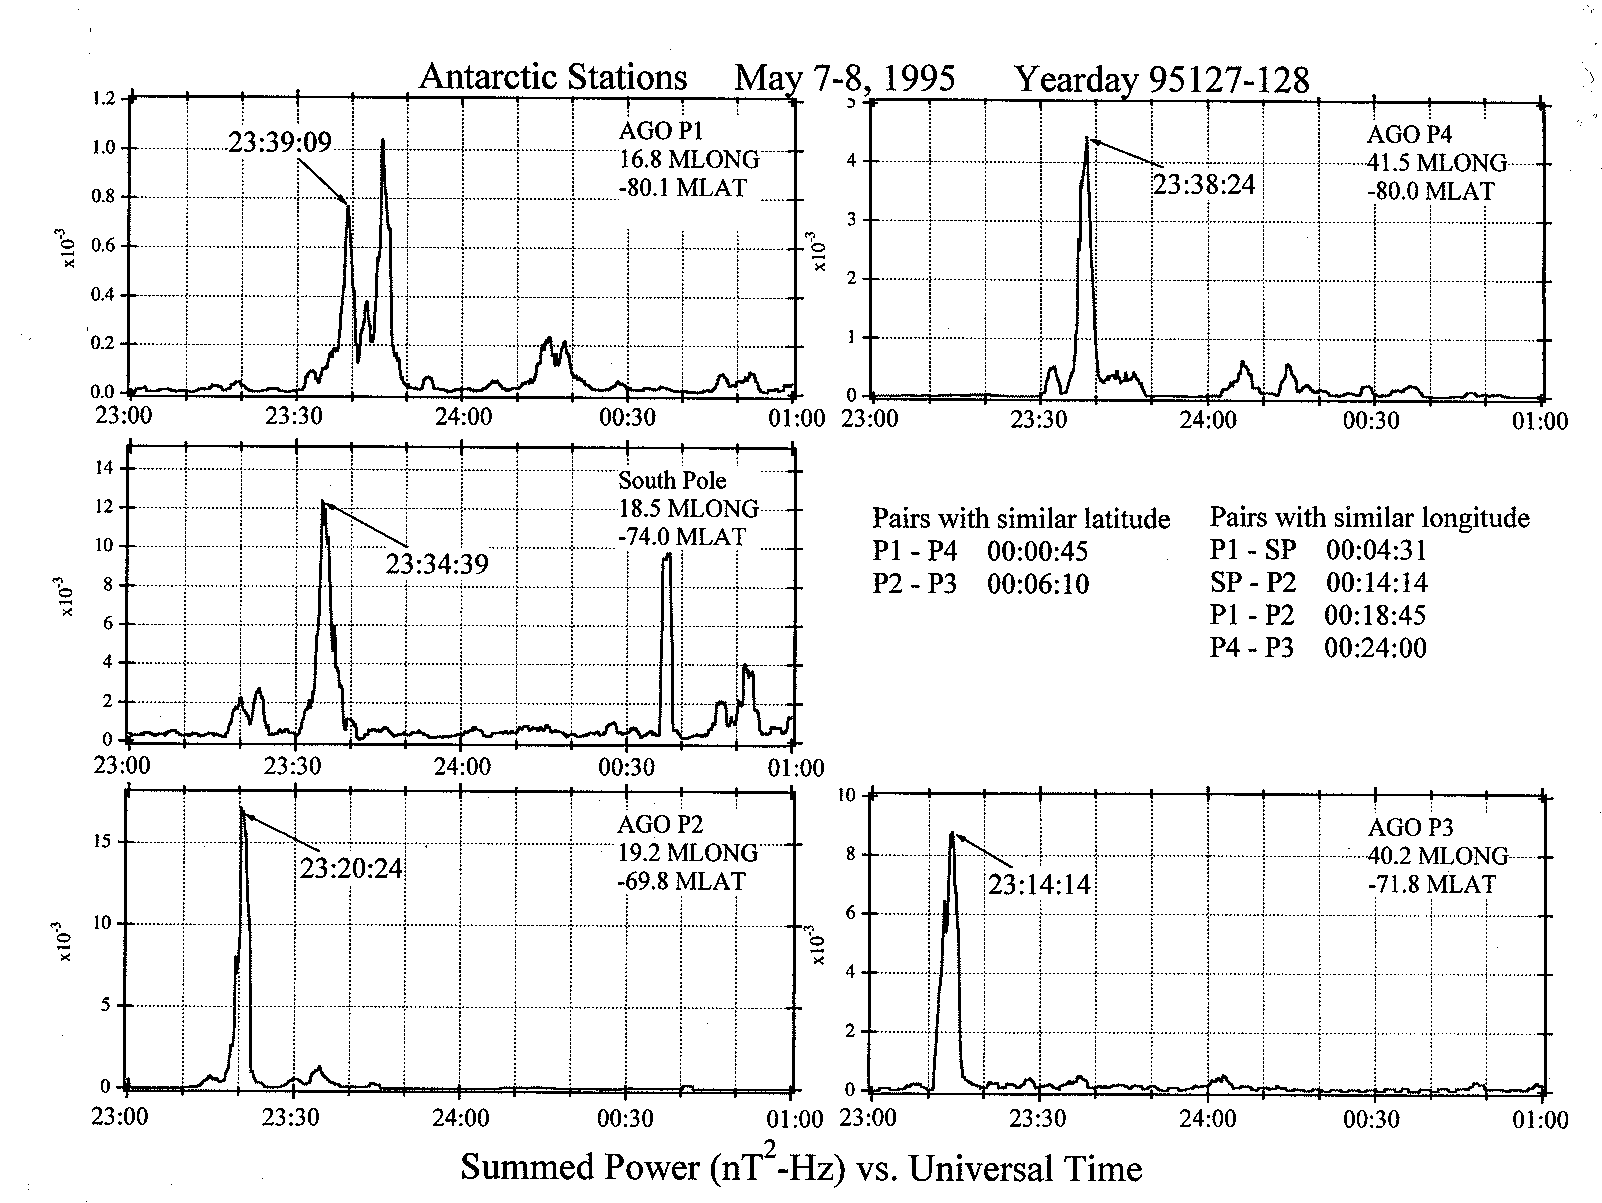
Figure from Multistation and conjugate observations of ultra-low-frequency substorm signatures at very high latitudes
Return to the article from which this figure is taken.

|
| Figure 1. Graphs showing summed power over 300-500 mHz vs. Universal Time. Each panel summarizes 2 hours of data centered around midnight UT on 7 May 1995 for the five antarctic stations that observe the Pi 1 activity near 23:30 UT. The time of the first large, sharp peak is indicated on each graph. The timing between stations is shown below the AGO P4 graph. (MLONG denotes magnetic longitude. nT2-Hz denotes nanoteslas squared-hertz.) |