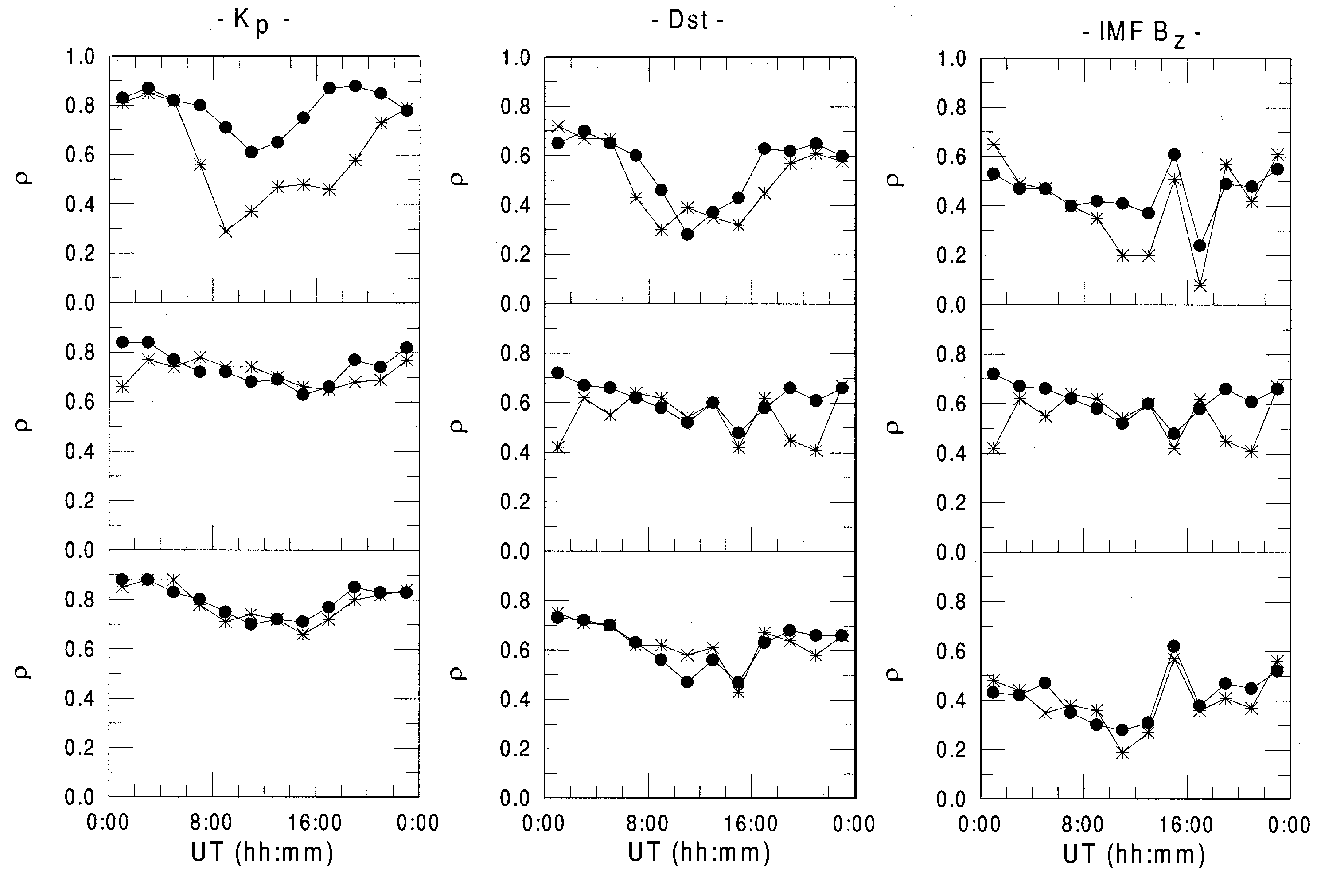
Figure from A southern high-latitude geomagnetic index: AES-80
Return to the article from which this figure is taken.

|
| Figure 2. Correlations vs. time of geomagnetic indices with Kp, Dst, and IMF-Bz component; the top panels show correlation coefficients for AU (·) and AUS-80 (*), the middle panels show correlation coefficients for AL (·) and ALS-80 (*), the bottom panels for AE (·) and AES-80 (*); each point is shown at the center of the 2-hour interval to which it refers. |