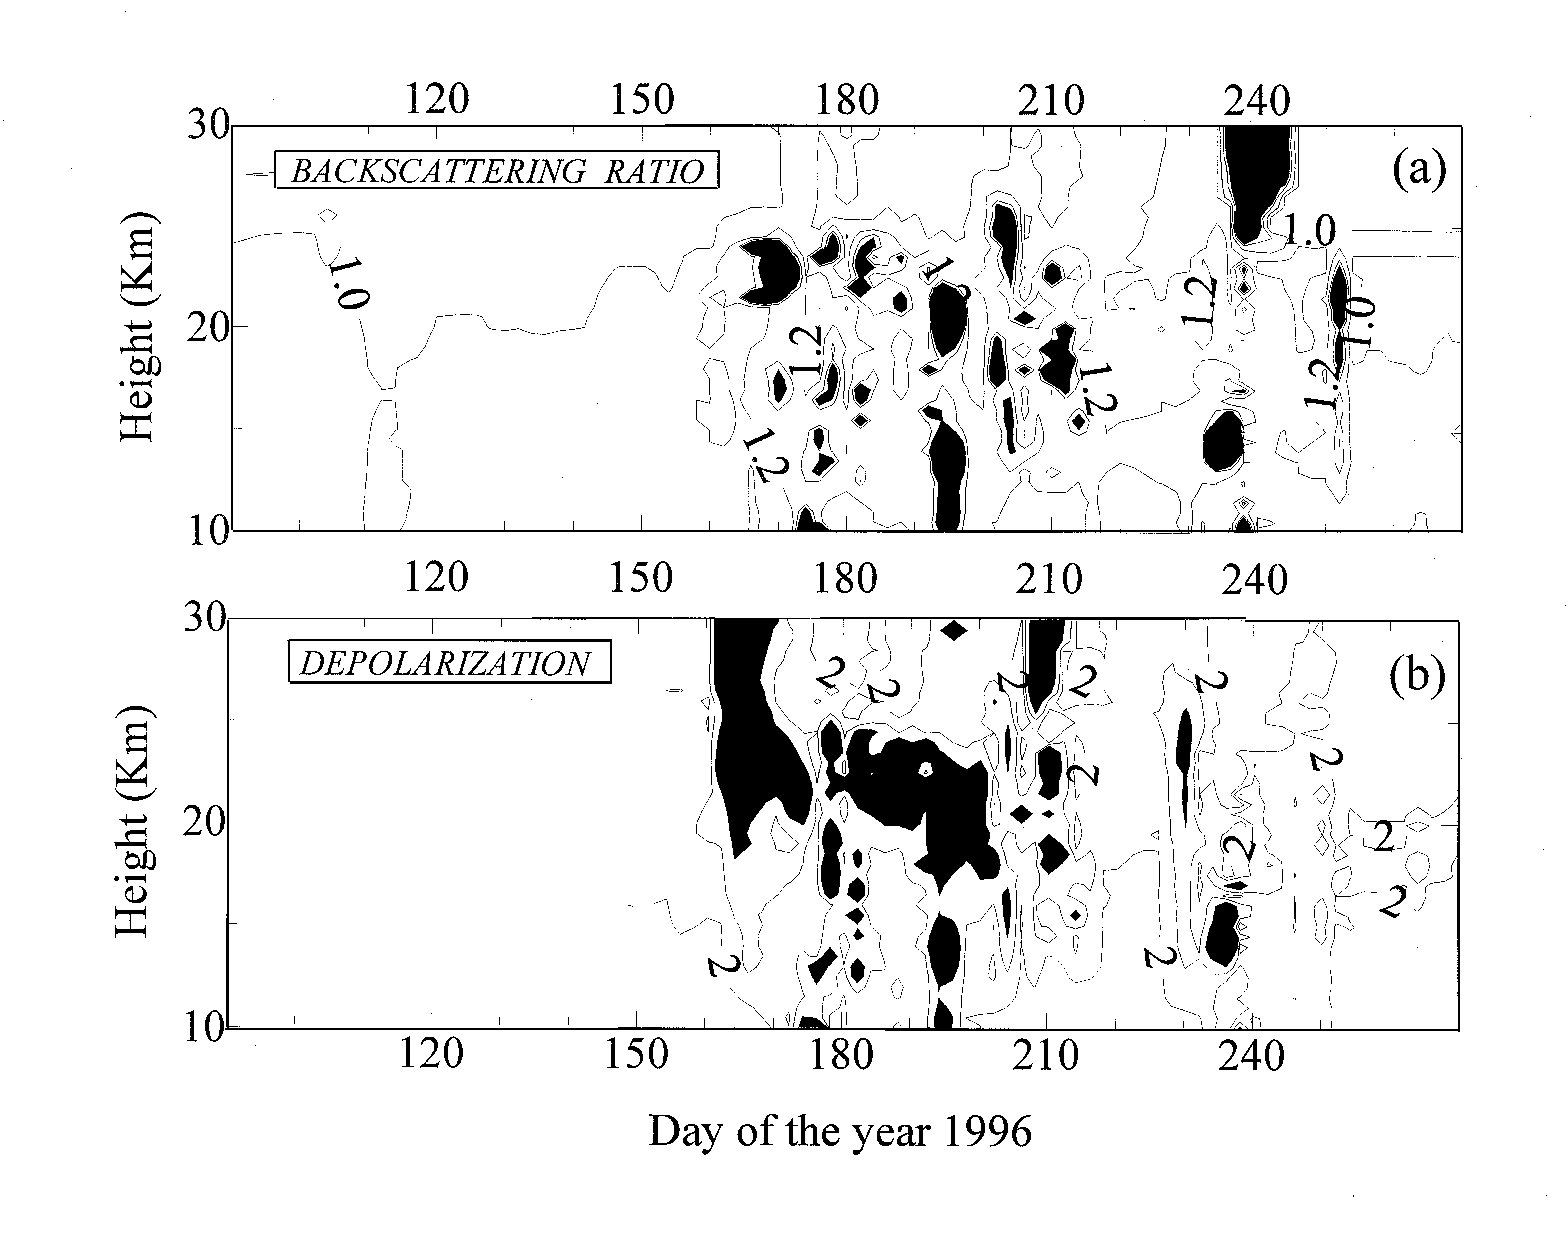
Figure from Lidar observations of stratospheric aerosol and temperatures at McMurdo Station during 1996
Return to the article from which this figure is taken.

|
| Figure 1. Backscattering ratio ( A ) and depolarization ( B ) versus julian day and altitude in the 1996 above McMurdo Station. Black area denotes values higher than 1.5 ( A ) and 5 ( B ). |