Figure from Nonhydrostatic numerical simulation of antarctic katabatic wind events
Return to the article from which this figure is taken.
 |
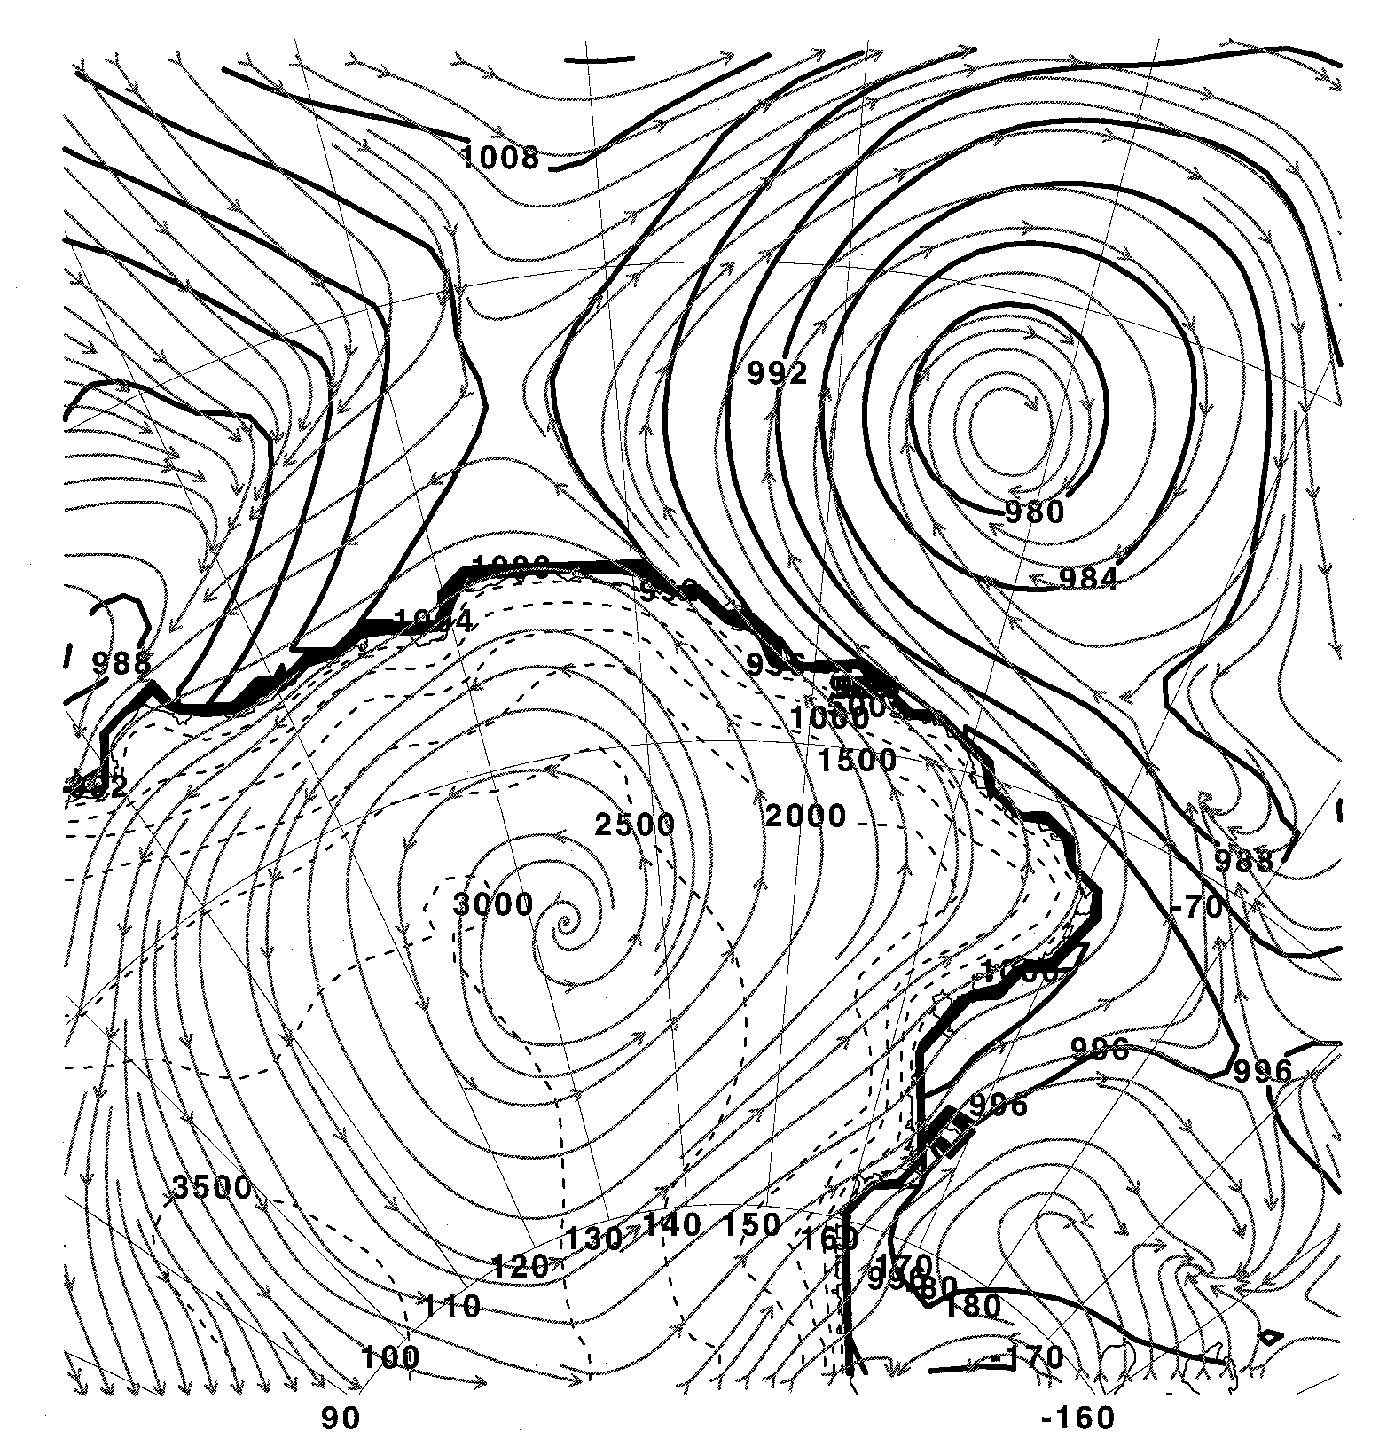
| Figure 1. Simulated weather conditions on 1200 UTC 25 March 1993 showing intence cyclone to the north of Antarctica. Surface pressures (in hectopascals) are represented by solid dark lines, streamlines of surface winds in solid, thin lines. Antarctic terrain in dashed lines. |