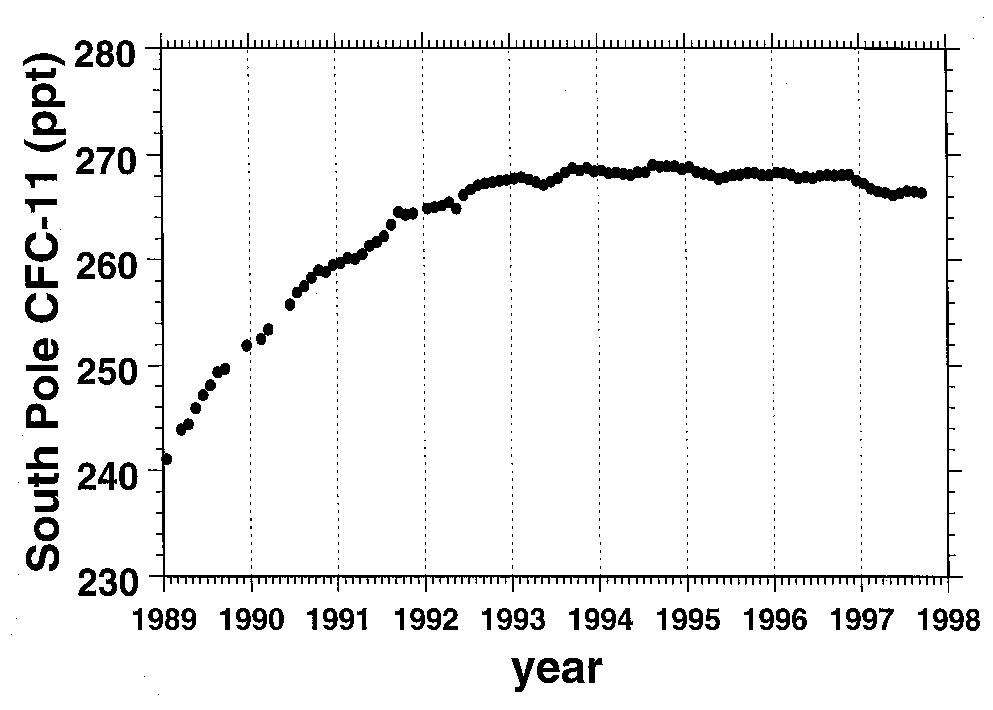
Figure from Clean-air monitoring at Amundsen-Scott South Pole Station, 1996-1997
Return to the article from which this figure is taken.

|
| Figure 2. Monthly average of trichlorofluoromethane (CFC-11) mixing ratios in parts per trillion (ppt) from in situ measurements. |