Figure from Measurement of combustion effluent aerosols from Amundsen-Scott South Pole Station
Return to the article from which this figure is taken.

|
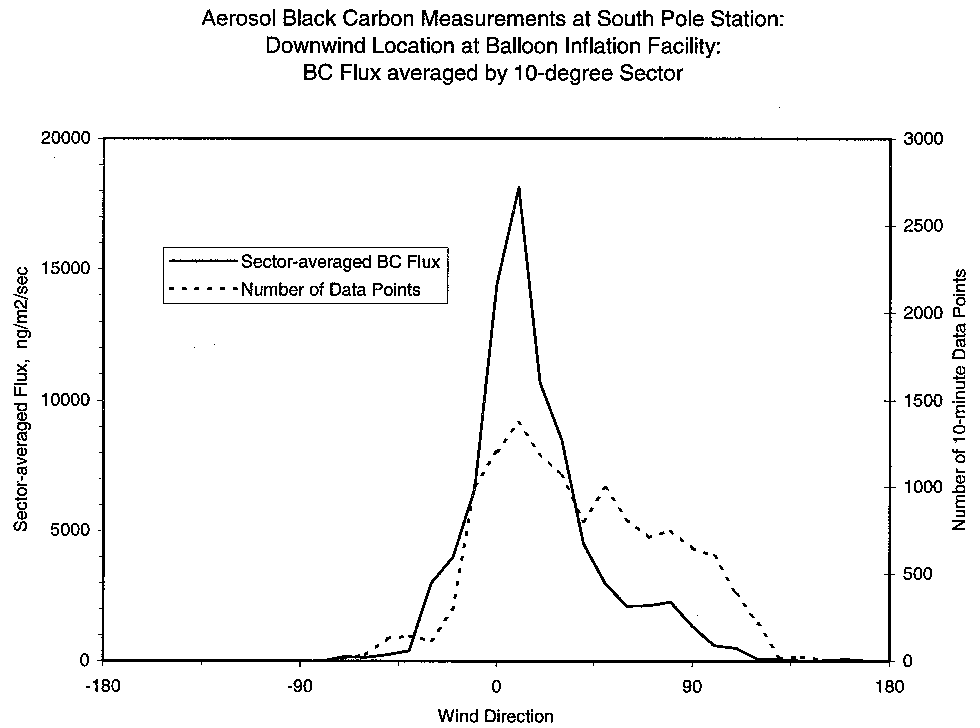
| Figure 3. Flux of BC (concentration times wind speed) passing over the downwind BIF location, gathered into 10-degree sectors of wind direction. The solid line shows the BC flux data; the broken line shows the number of 10-minute data points included in each 10-degree wind direction sector. |