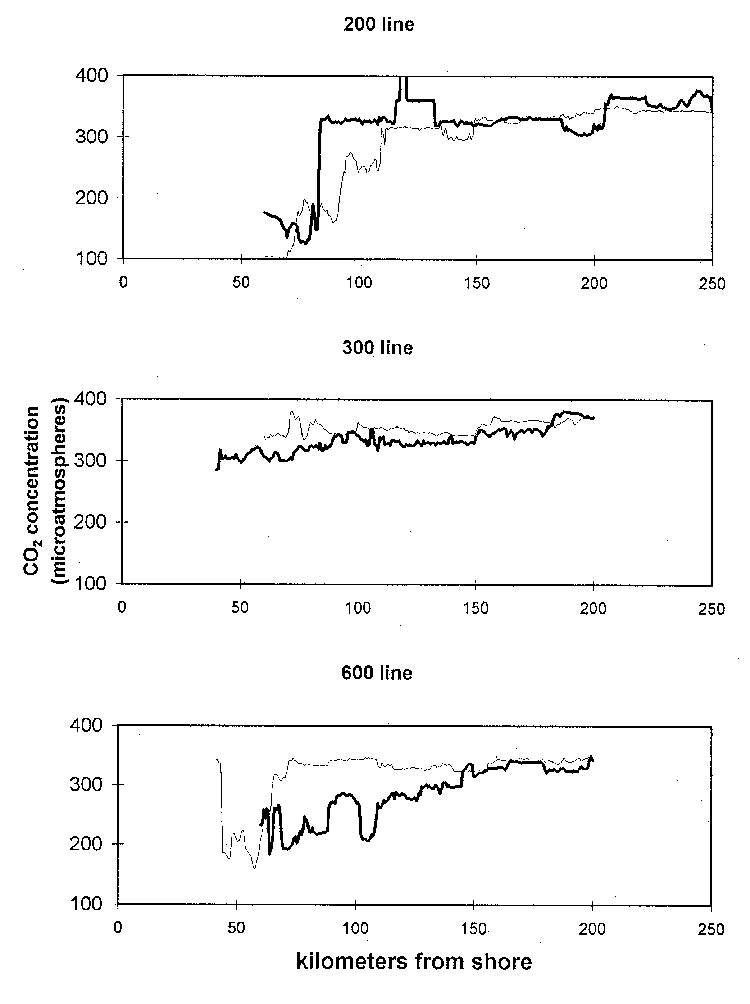
Figure from Palmer LTER program: Underway semicontinuous measurements of surface ocean carbon dioxide concentrations
Return to the article from which this figure is taken.

|
| Figure 2. Surface water CO2 concentrations in microatmospheres, for samples collected on the 200, 300, and 600 lines of the LTER grid. Thick dark lines represent data from the 1995-1996 LTER field season and the thin dark lines represent data from the 1996-1997 LTER field season. |