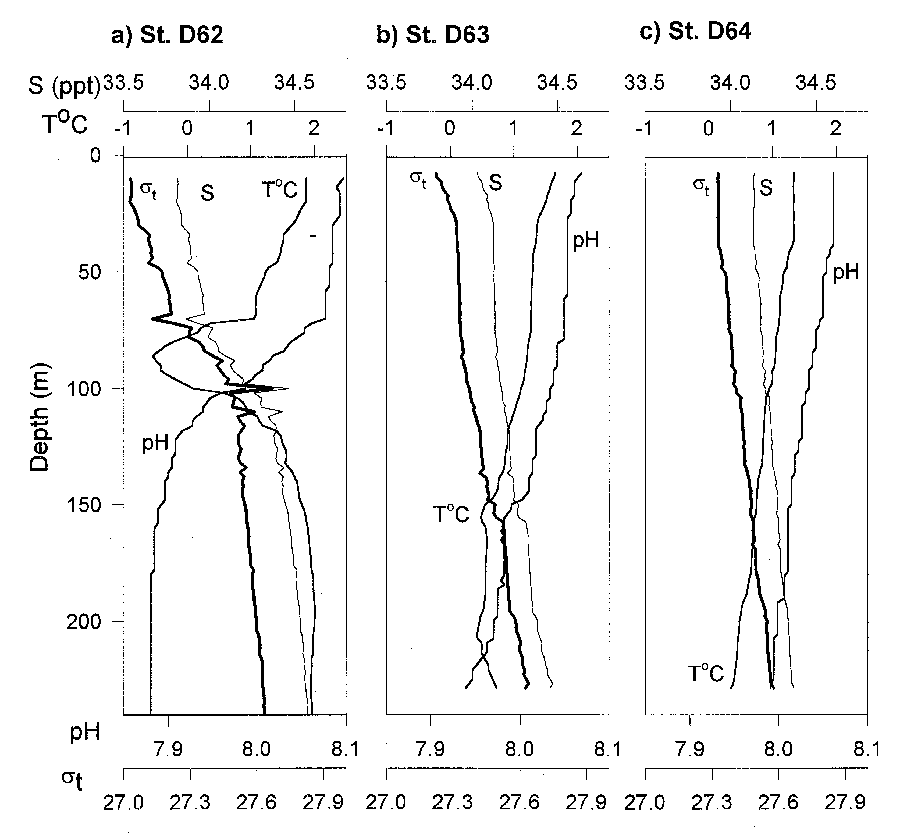
Figure from AMLR program: Variability of pH in the upper water column
Return to the article from which this figure is taken.

|
| Figure 2. Profile data for salinity, temperature, pH, and Sigma-t between the surface and 240 meters depth at Station D62 (Water Zone I ), Station D63 (Water Zone II), and Station D64 (Water Zone IV). |