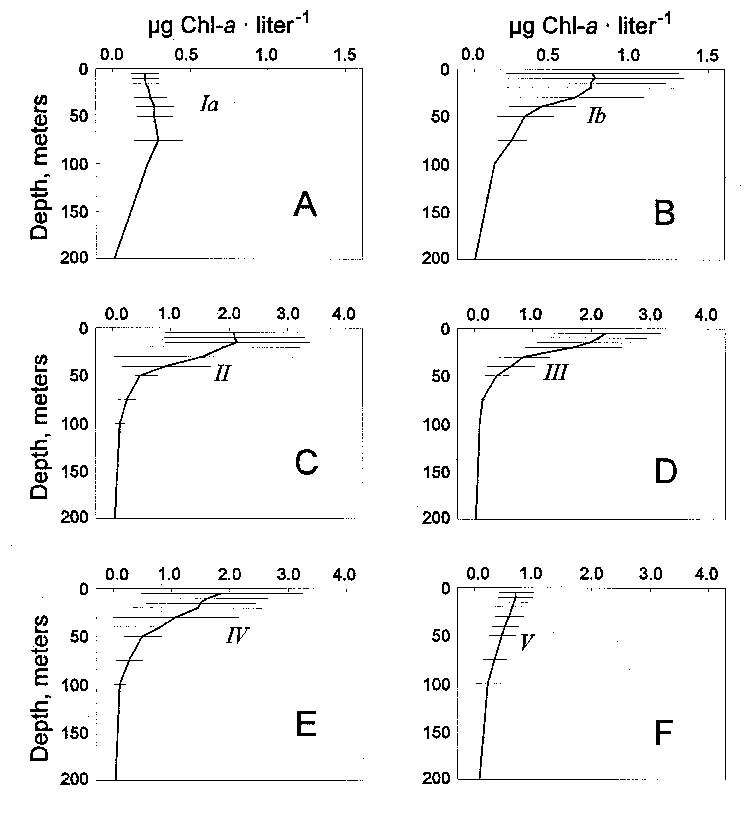
Figure from AMLR program: Phytoplankton distribution and its relationship to different water zones characterized by physical oceanographic parameters, January to February 1997
Return to the article from which this figure is taken.

|
| Figure 2. Distribution of chlorophyll- a with depth in the various water zones defined by temperature and salinity characteristics. The separation of Water Zone I stations into Water Zones Ia (33 stations) and Ib (6 stations) has been done on the basis of both biological and physical measurements. See Amos et al. ( Antarctic Journal , in this issue) for listing of all stations included in Water Zone I. Of these 39 stations in Water Zone I, 6 stations (A58, A59, A60, A73, A74, A129) have been placed in Water Zone Ib and the remaining 33 stations in Water Zone Ia. Each curve represents the mean at any depth for all stations in that water zone; the horizontal lines represent ±1 standard deviation. Note that the values on the abscissa in Water Zones Ia and Ib are smaller than for the other four water zones. |