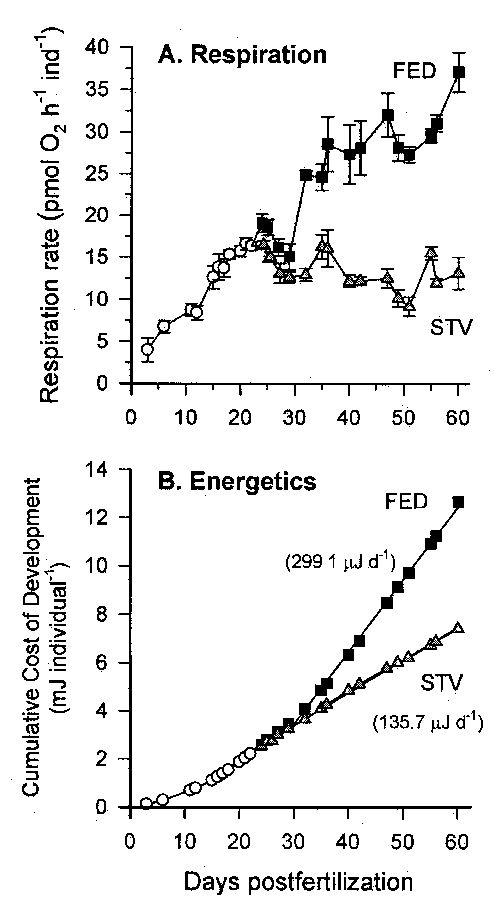
Figure 2. Energy metabolism during development of Sterechinus neumayeri . A . Respiration rates. B . Cummulative cost of development. Symbols are plotted as means (± standard error of the mean; n=3); embryos = open circles; fed plutei = closed squares; starved plutei = shaded triangles. (mJ d-1 denotes microjoules per day. mJ individual-1denotes millijoules per individual. pmol O2 h-1 ind-1 denotes picomoles of oxygen per hour per individual.)