Figure from Feeding and energetic costs of larval development in the antarctic sea urchin Sterechinus neumayeri
Return to the article from which this figure is taken.
|
|
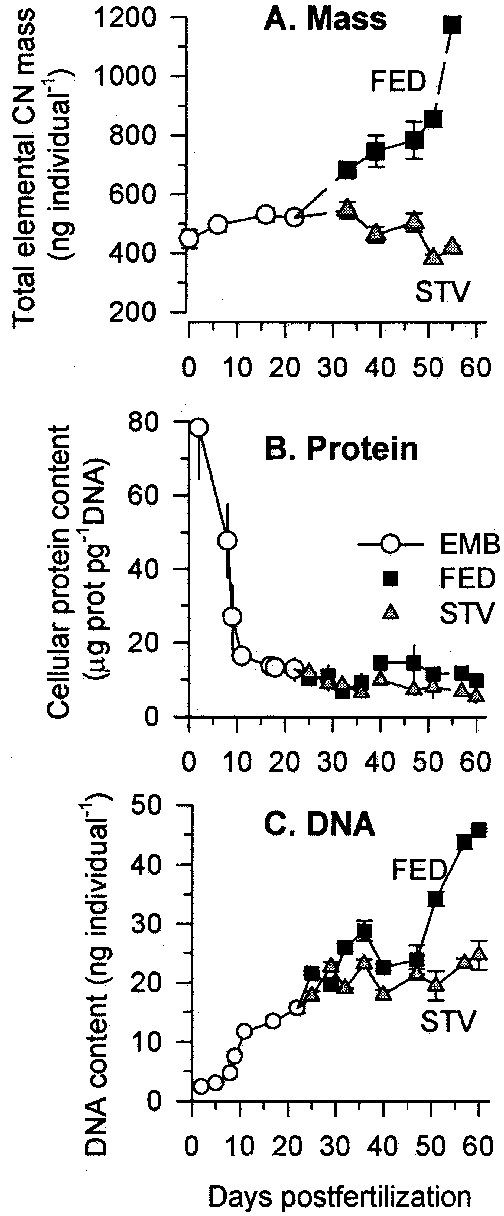
Figure 1. Biochemical components during development of Sterechinus neumayeri. A . Organic mass. B . Cellular protein content. C . Individual DNA content. Symbols are plotted as means (± standard error of the mean; n=3); embryos = open circles; fed plutei = closed squares; starved plutei = shaded triangles. (ng individual-1 denotes nanograms per individual. g prot pg-1 DNA denotes microgram of protein per picogram of DNA.) |