Figure from Effects of feeding conditions on sodium pump (Na+,K+-ATPase) activity during larval development of the antarctic sea urchin Sterechinus neumayeri
Return to the article from which this figure is taken.

|
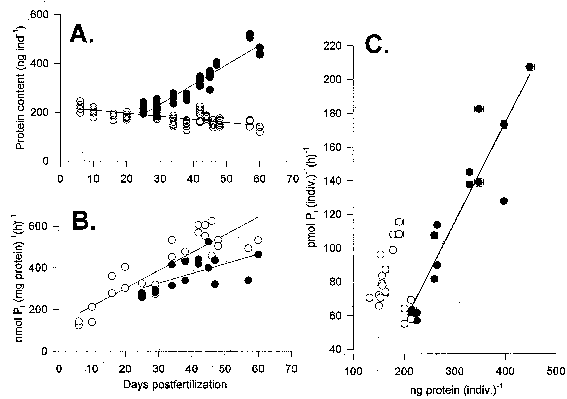
| Figure 2. A . Protein content of Sterechinus neumayeri during development of prefeeding stages (up to day 22, open circles) and in fed (solid circles) and starved larvae (after day 22, open circles). Each point is a single measurement of protein. (ng ind-1 denotes nanograms per individual.) B . Protein-specific total Na+,K+-ATPase activity (stages of development as in A ). Each data point is the mean of 3-5 replicates. Error bars are ± standard error of the mean; where not shown, bar is within the graphical representation of the data points. [nmol Pi (mg protein)-1 (h)-1 denotes nanomoles of inorganic phosphate per milligram of protein per hour.] C . Total Na+,K+-ATPase activity as a function of protein content in fed (solid circles) and starved larvae (open circles) (prefeeding stages, days 5-21, not included in this data set). Each data point for total Na+,K+-ATPase activity is the mean of 3-5 assay replicates. Vertical error bars are ± standard error of the mean. Three to eight replicates were done for protein assays. Horizontal error bars are ± standard error of the mean. Most error bars are within the graphical representations of the data points. [ng protein (indiv.)-1 denotes nanograms of protein.] |