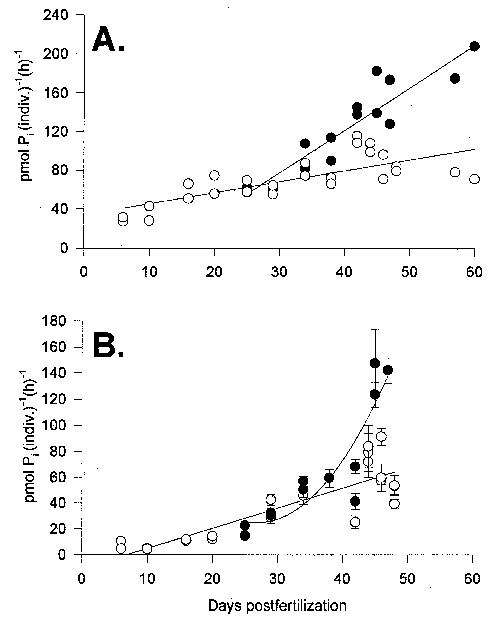
Figure from Effects of feeding conditions on sodium pump (Na+,K+-ATPase) activity during larval development of the antarctic sea urchin Sterechinus neumayeri
Return to the article from which this figure is taken.
 |
| Figure 1. A . Total Na+,K+-ATPase activity in Sterechinus neumayeri during development of prefeeding stages (open circles) and in fed (solid circles) and starved larvae (after day 22, open circles). Measurements were made at 15°C by an in vitro enzyme assay and are presented as equivalents of ATPase activity at -1.0°C (see text for details on rate conversions using measured Q10 value). A final concentration of 14 millimolar of ouabain was used for the assay. Each data point is the mean of 3-5 replicates. Error bars are standard error of the mean; where not shown, bar is within the graphical representation of the data point. B . Physiologically active ( in vivo ) Na+,K+-ATPase in prefeeding stages (before day 22) and in fed (solid circles) and starved larvae (open circles). Each data point represents the rate of K+ transport calculated from a time course transport experiment performed at -1.0°C with 8-9 individual data points. [K+ transport was measured as 86Rb+ flux with correction for specific activity of K+ in seawater, see Leong and Manahan (1997) for details.] Each error bar is standard error of the slo pe of each individual linear regression line. [pmol Pi (indiv.)-1 (h) -1 denotes picomoles of inorganic phosphate per individual per hour.] |