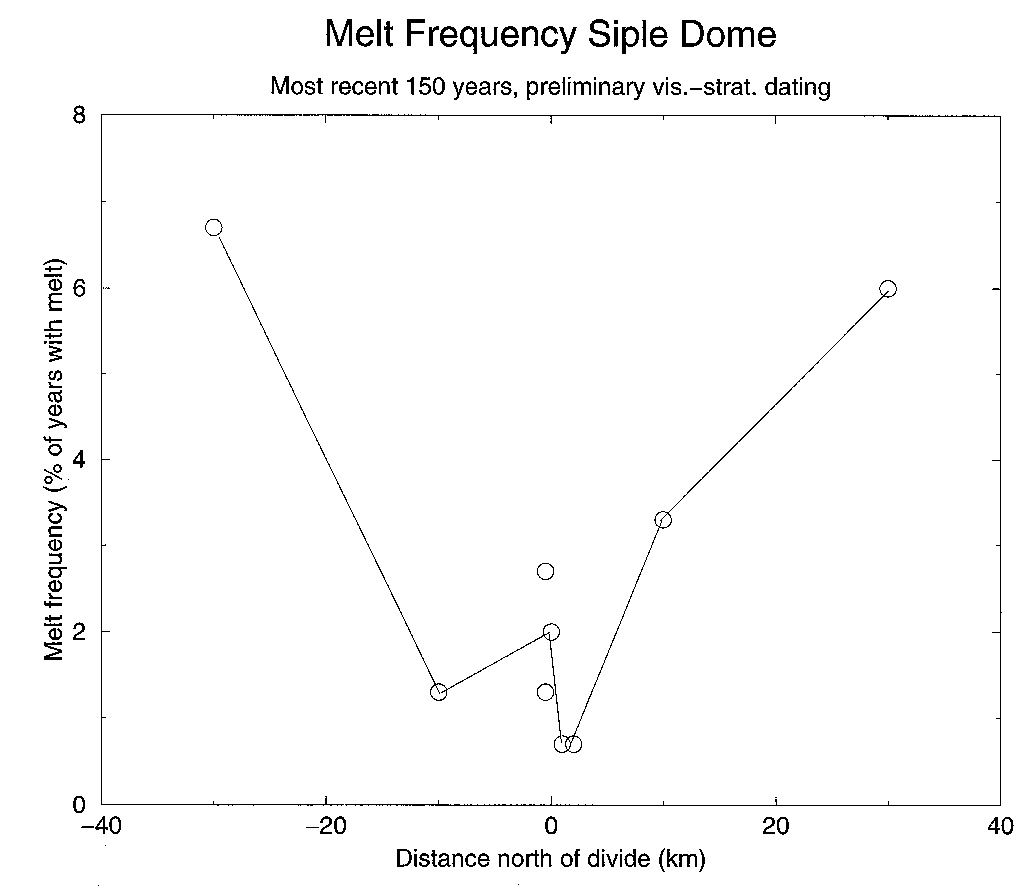
Figure from Visible examination of Siple Dome, West Antarctica, shallow cores
Return to the article from which this figure is taken.
 |
| Figure 2. Frequency of melt occurrence for the Siple Dome cores, as a function of position from south to north across the dome. The most recent 150 years were used for the calculation in all cases, so that this represents spatial variability rather than time trends. (vis.-strat. denotes visible-stratigraphic.) |