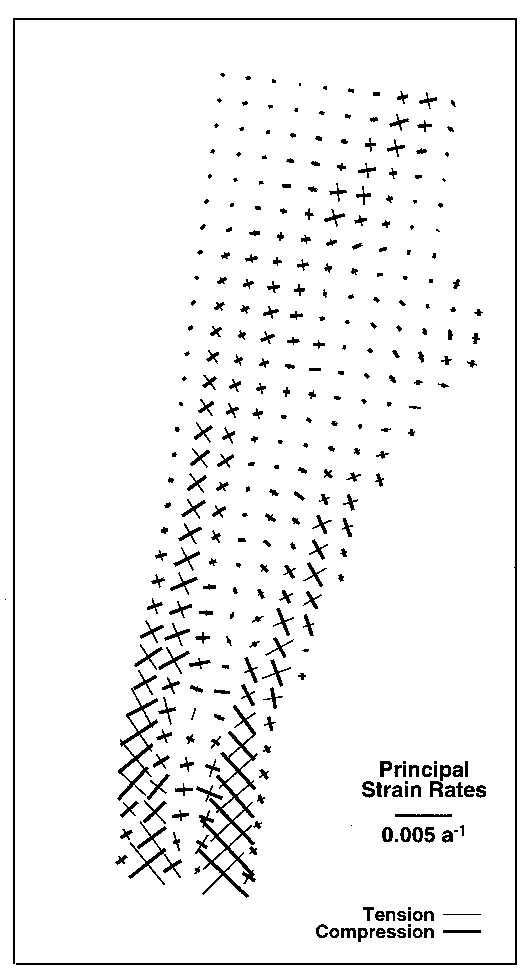
Figure from Surface velocity and strain rates at the onset of ice stream D, West Antarctica
Return to the article from which this figure is taken.
 |
| Figure 2. Strain rates calculated from velocity field. Fine lines are principal tension; heavy lines are principal compression. (a-1 denotes per year.) |