Figure from Diatoms in subglacial sediments yield clues regarding west antarctic ice-sheet history and ice-stream processes
Return to the article from which this figure is taken.
|
|
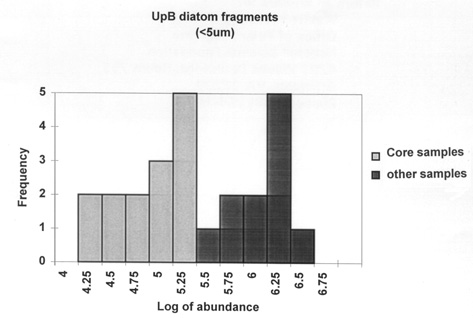
| Frequency plot of diatom fragment abundance (log scale). Light columns are core samples; dark columns are core tops and noncore samples. (um denotes micrometers.) |