Figure from Palmer LTER: Stable interannual successional patterns of phytoplankton communities in the coastal waters off Palmer Station, Antarctica
Return to the article from which this figure is taken.

|
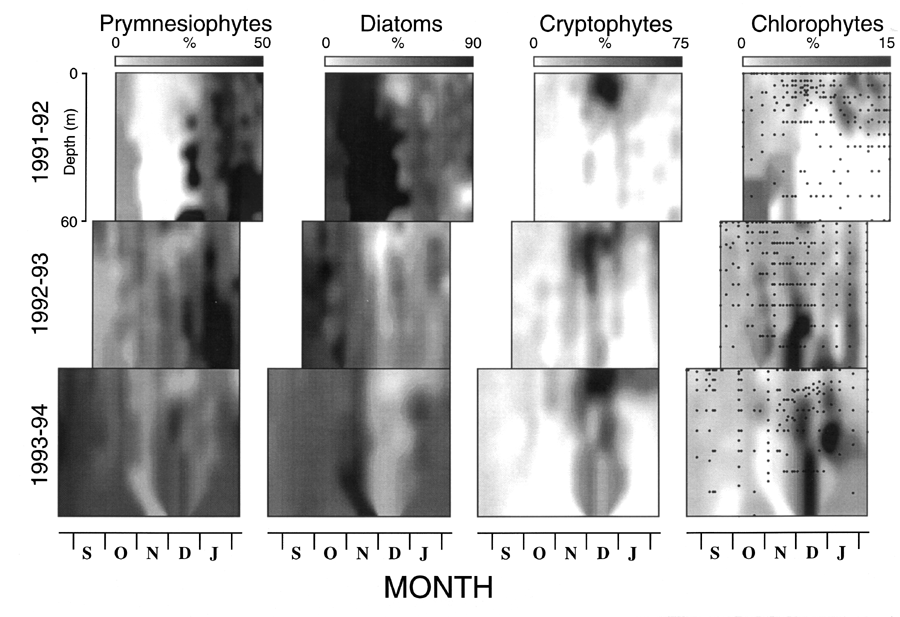
| Figure 3. The seasonal variation in depth distribution of the percentage of total chlorophyll- a concentration by four phytoplankton groups at LTER station B from 1991 to 1994. Note the differences in the percentage scale for each taxonomic group. Overlayed on the contours for chlorophytes is the depth/time distribution of discrete samples (filled circles). |