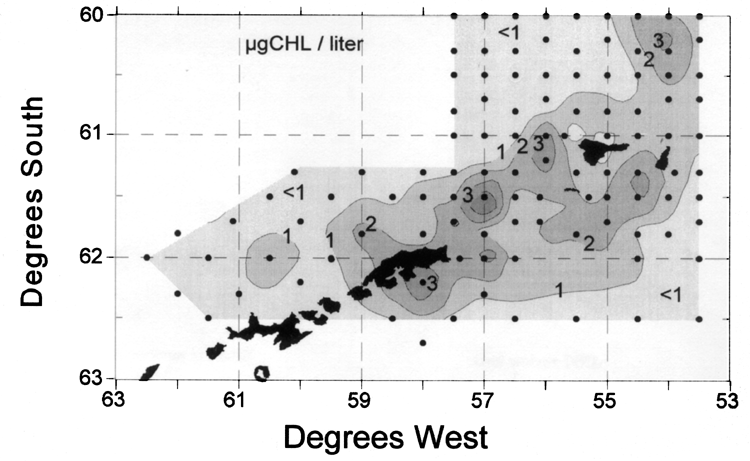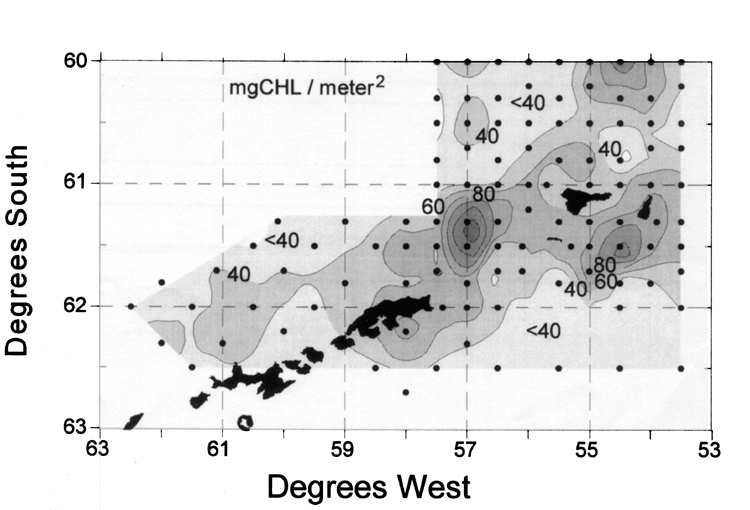

Figure from AMLR program: Phytoplankton distribution and its relationship to different water zones characterized by physical oceanographic parameters, January to February 1997
Return to the article from which this figure is taken.
 |
 |
| Figure 1. Chlorophyll- a concentrations (micrograms/liter) at 5 meters depth (upper figure) and integrated chlorophyll- a concentrations (lower figure; milligrams per square meter from 0 to 100 meters) in the survey area. |