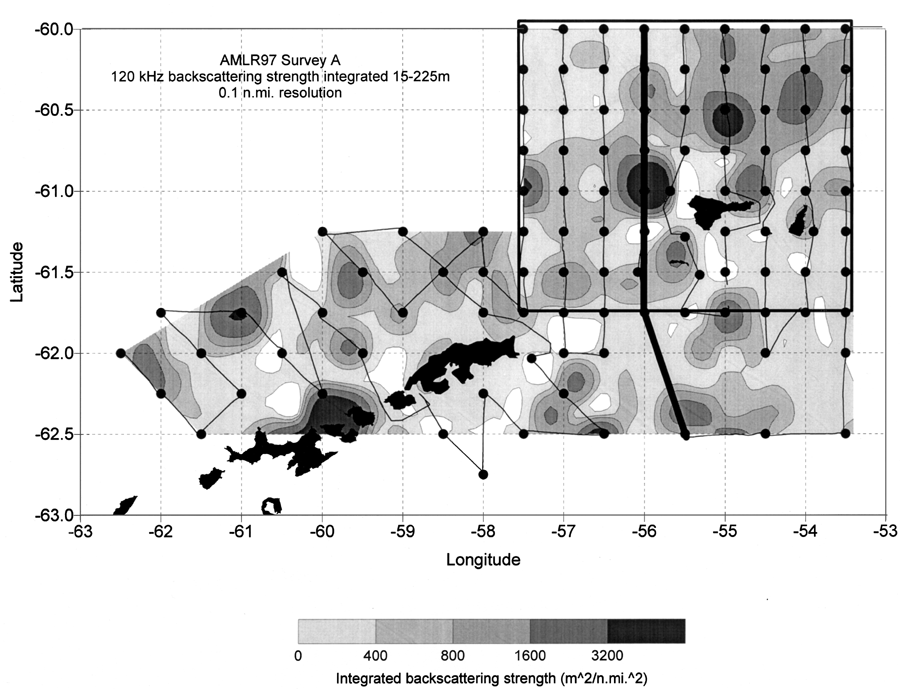
Figure from AMLR program: Distribution of volume backscattering strength near Elephant Island in the 1997 austral summer
Return to the article from which this figure is taken.
 |
| Figure 1. Integrated volume backscattering strength at 120 kilohertz (kHz). Transects are indicated by thin lines and stations are indicated by dots. The bold transect at 56W longitude indicates the position of the acoustic cross-section described in figure 2. The box around Elephant Island indicates the area for which average krill biomass density was estimated. (m denotes meter. n.mi. denotes nautical mile. m^2/n.mi.^2 denotes square meter/square nautical mile.) |