
How do states compare in employment in S&E jobs?
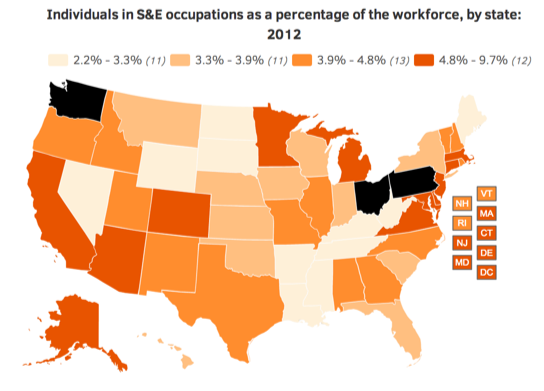
Individuals in S&E occupations as a percentage of the workforce, by state: 2012
- Notes:
- S&E = science and engineering. S&E occupations are those in biological/agricultural/environmental life sciences, physical sciences, computer sciences, mathematics/statistics, engineering, psychology, and social sciences. Physical sciences = chemistry, physics, astronomy, and earth/ocean/atmospheric sciences.
In 2012, 4.6% of the U.S. workforce (about 6 million people) worked in occupations classified as S&E, an increase from the nearly 5 million S&E workers in 2003.
Key Observations
- At 9.7%, the District of Columbia had the highest percentage of the workforce engaged in S&E occupations in 2012.
- Virginia (7.6%) and Maryland (7.2%), the two states adjacent to the District of Columbia, were among the 4 states with the highest percentages of S&E workers. The other two were Massachusetts (7.2%) and Colorado (6.7%).


 @NSF_NSB
 NSB
NSB