
How well do U.S. 4th grade students score in math and science in each state?
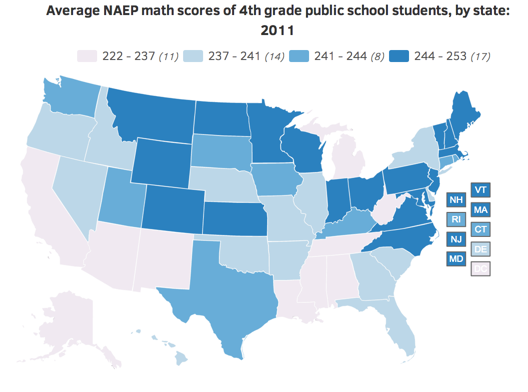
Average NAEP math scores of 4th grade public school students, by state: 2011
Average NAEP science scores of 4th grade public school students,
by state: 2009
by state: 2009
- Notes:
- NAEP = National Assessment of Educational Progress (The Nation's Report Card)
- Notes:
- NAEP = National Assessment of Educational Progress (The Nation's Report Card)
The states with the highest average math scores for 4th grade public school students were concentrated primarily in the northern United States.
The average science score for 4th grade public school students in 2009 (149) was higher than in 2000 (145), but remained unchanged from 2007.
Key Observations
- In 2011, the nationwide average math score of 4th grade public school students was 240, an increase from 234 in 2003.
- Of the 46 states and jurisdictions that participated in the 4th grade science assessment, 24 states had scores that were higher than the national average, 12 were not significantly different, and 10 were lower.

Education Progress
How well do U.S. 8th graders score in math and science in each state?
Explore this topic in the Science and Engineering Indicators Report:
Education Progress
How well do U.S. 8th graders score in math and science in each state?
Explore this topic in the Science and Engineering Indicators Report:


 @NSF_NSB
 NSB
NSB