If you are unable to access any information on this page, please contact the Office of Integrative Activities at 703-292-8040.
on the
National Science Foundation
Merit Review System
Fiscal Year 1999
TABLE OF CONTENTS
| HIGHLIGHTS | |
| 1. | Proposals and Awards Competitively Reviewed Proposals, Awards and Funding Rates Characteristics of Principal Investigators Award Amounts |
| 2. | Methods of Proposal Review Review Processes Used at NSF Reviews and Reviewers Reviewer Proposal Ratings NSF Program Officers Assuring Objectivity in the Merit Review Process |
| 3. | Other Issues Related to Merit Review Committee of Visitors (COV) Government Performance and Results Act (GPRA) Use of Preliminary Proposals Cost Sharing Policy Revision Small Grants for Exploratory Research (SGER) Accomplishment Based Renewals and Creativity Extensions Exemptions to the Merit Review Process |
HIGHLIGHTS
| 1. | During FY 1999 NSF took action on 28,504 competitively reviewed proposals, and provided funding to 9,112 of them. This resulted in an overall funding rate of 32 percent. These numbers have changed very little during the past five years. In FY 1999, Directorate funding rates ranged from 27 percent to 42 percent. |
| 2. | The funding rates for proposals from minority Principal Investigators (PIs) were below the NSF average in FY 1999, and have been for seven of the past eight years. The number of proposals received yearly from minority PIs has decreased by 5 percent since FY 1992. |
| 3. | Since FY 1992, the funding rates for proposals received from female PIs and male PIs have been similar. (In FY 1999 it was 31 percent for females compared to 32 percent for males.) The number of proposals received from female PIs increased by 19 percent during that seven year period. |
| 4. | There continues to be considerable disparity in the funding rates of proposals from "new PIs" and "prior PIs" (23 percent and 39 percent, respectively, in FY 1999). |
| 5. | The average and median award size increased by 3.3 percent and 3.5 percent respectively. In FY 1999 the average award size for research grants was $92,788 and the median was $73,335. In NSF's FY 2001 Government Performance and Results Act (GPRA) Performance Plan, a specific goal is to increase the average annualized award size for research projects to $108,000. |
| 6. | Since 1990, the percentage of NSF proposals reviewed by panel-only has increased from 36 to 47 percent, while the use of mail-only review has decreased from 33 to 18 percent. The use of mail-plus-panel review increased from 32 to 35 percent during this period. This may reflect a number of factors, such as the growing number of multidisciplinary proposals received and the declining response rate of mail reviewers. |
| 7. | NSF received a total of more than 246,000 reviews in FY 1999, for an average of 8.3 reviews per proposal. The response rate to mail review requests has decreased to 59 percent from 62 percent in FY 1998. |
| 8. | In FY 1999, over 8,000 proposals with average summary ratings between Very Good and Excellent were declined. The judgment of NSF staff is essential to making this difficult separation between awards and declines. The data also indicate that a large number of potentially fundable proposals are declined each year. |
| 9. | The use of preliminary proposals has increased in frequency over the past several years in NSF programs. In FY 1999, NSF acted on 1,594 preliminary proposals that were logged into the proposal processing system. Of these, NSF encouraged the submission of full proposals in 221 cases and discouraged submission in 1,373 cases. |
Among the Federal agencies, NSF has a unique mission: to strengthen the overall health of U.S. science and engineering across a broad and expanding frontier. NSF invests in the best ideas from the most capable people, determined by competitive merit review. The merit review system is at the very heart of NSF's selection of the projects through which its mission is achieved. NSF evaluates proposals for research and education projects using two criteria: the intellectual merit of the proposed activity and the broader impacts of the proposed activity on society.
The FY 1999 Report on the NSF Merit Review System responds to a National Science Board (NSB) policy endorsed in 1977 and amended in 1984, requesting that the Director of the National Science Foundation (NSF) submit an annual report on the NSF proposal review system. This report provides summary information about levels of proposal and award activity and the process by which proposals are reviewed and awarded.
Competitively Reviewed Proposals, Awards and Funding Rates
During FY 1999, NSF took action on 28,504 competitive, merit reviewed
research and education proposals, as shown in Text Figure 1. The
number of proposals reviewed annually by NSF has been reasonably stable
at around 30,000 proposals since 1995.
NSF funding was awarded to 9,112 of the proposals, resulting in an overall funding rate of 32 percent. The number of awards made each year has varied between approximately 9,000 and 10,000. The overall funding rate has varied little since 1995. However, funding rates among directorates* varied considerably, ranging from 27 percent to 42 percent as shown in Appendix Table 1.
*The term "directorates" as used in this report, refers to NSF's seven programmatic directorates and the Office of Polar Programs.
Text Figure 1
NSF Proposal, Award and Funding Rate Trends
Fiscal Year
| 1995 | 1996 | 1997 | 1998 | 1999 | |
| Proposals | 30,700 | 30,231 | 30,189 | 28,318 | 28,504 |
| Awards | 9,563 | 9,071 | 9,864 | 9,279 | 9,112 |
| Funding Rate | 31% | 30% | 33% | 33% | 32% |
In addition to funding proposals that were competitively reviewed during FY 1999, NSF awarded 6,896 continuing grant increments (CGIs) based on proposals which had been competitively reviewed in earlier years. CGIs are funded in annual increments from current year appropriations. The CGI procedure complements the other major type of NSF award instrument - standard grants - where all funds for a multiple year project are obligated in the initial award. NSF policy limits the amount of next year's CGI commitments to 65 percent of a program's current fiscal year operating plan.
Characteristics of Principal Investigators
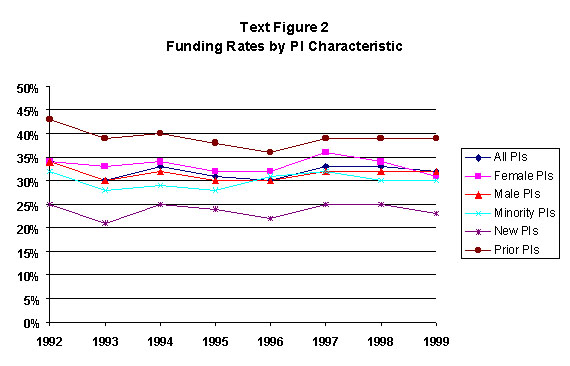
Trends in funding rate for all PIs, female and minority PIs, and prior
and new PIs are shown in Text Figure 2. Proposals, awards, funding
rates and trends by PI characteristics are presented in Appendix Table 2.
The differences in funding rates of proposals from female PIs and male PIs have been minor over the past few years. However, the funding rates for proposals from minority PIs have been below the overall NSF funding rate for seven of the past eight years.
The number of proposals received from female Principal Investigators (PIs) has increased by 19% since 1992, as shown in Appendix Table 2. The same has not been true for PIs from minority groups, which has decreased by 5%. During FY 1999, about 19 percent of competitively reviewed proposals were from female PIs down from 20 percent in FY 1998, and five percent were from minority PIs (level with FY 1998.)
Forty-one percent of the competitively reviewed proposals in FY 1999 were from PIs who had never received an NSF award ('new PIs'), up slightly from FY 1998. There continues to be a wide disparity in the funding rates of "new PIs" and "prior PIs" (23 percent and 39 percent, respectively in FY 1999). As indicated in Appendix Table 2, in FY 1999 the number of awards to new PIs decreased from 3,041 to 2,675, or 12 percent.
In order to encourage the proposal and award process to be open to new people and new ideas, NSF has established an FY 1999 GPRA performance goal of 30 percent of competitive research grants going to new investigators. The FY 1999 result was 27 percent. The FY 2000/01 goals will continue to be 30%. The Agency is committed to maintaining openness in the system and will strive to increase the percentage of awards to new investigators. NSF will explore whether the pool of new investigators is smaller than in previous years, whether they are submitting fewer proposals, etc., and use this information to design future strategies.
Award Amounts
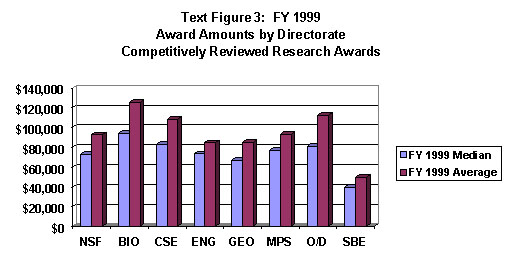
The median annual award amount (adjusted for multiple year projects) among
competitive research awards made during FY 1999 was $73,335, a 3.5 percent
increase from FY 1998. The average annualized award amount in FY 1999
was $92,788, an increase of 3.3 percent from FY 1998. The difference between
the median and average award amounts reflects the effect of numerous small
awards on the median, and a few large awards for centers, facilities,
and large systemic initiatives on the average award amount.
Award amounts have been consistent over the past decade, when adjusted to constant dollars as measured by the Consumer Price Index. There are considerable differences among directorates, as shown in Text Figure 3. Data on median and average award amounts from FY 1995-1999 are presented by directorate in Appendix Table 3.
Adequate award size is important both to getting high quality proposals and to ensuring that proposed work can be accomplished as planned. Larger awards also enable scientists and engineers to devote a greater portion of their time to research. In NSF's FY 2001 Government Performance and Results Act (GPRA) Performance Plan, a specific goal is to increase the average annualized award size for research projects to $108,000, and the average award duration from 2.7 to 3 years.
![]()
Peer Evaluation and Merit Review
The involvement of knowledgeable peers from outside the Foundation in
the review of proposals is the keystone of NSF's proposal review system.
Their judgements of the extent to which proposals address established
criteria are vital for informing NSF staff and influencing funding recommendations.
For this reason, NSF's system of proposal review can accurately be characterized
as "merit review with peer evaluation."
Review Processes Used at NSF
NSF programs obtain external peer review by two principal methods, mail
and panel. In addition to mail and panel reviews, site visits by NSF staff
and external peers are often used to review proposals for large facilities,
centers, and systemic reform initiatives. NSF program officers are given
discretion in the specific use of review methods, subject to supervisory
approval. For example, some programs try to manage proposal pressure by
requiring submission of preliminary proposals. Review of preliminary proposals
varies widely, ranging from non-binding advice from program officers to
proposers, to recommendations from external reviewers. The use of preliminary
proposals has increased in frequency over the past several years in NSF
programs. In FY 1999, NSF acted on 1,594 official preliminary proposals
that were logged into the proposal processing system. Of these, NSF encouraged
the submission of full proposals in 221 cases and discouraged submission
in 1,373 cases.
In "mail-only" reviews, peers are sent proposals and asked to submit written comments to NSF by postal mail, facsimile, electronic mail, or through FastLane, NSF's Web-based system for electronic proposal submission and review. These mail reviews are then used by the NSF program officer directly to support a recommendation for award or decline.
"Panel-only" review refers to the process of soliciting reviews only from those peers who meet in a panel review setting to discuss their reviews and provide advice directly to the program officer. Most programs that use this process provide proposals to panelists and receive their reviews prior to the panel meeting. Other programs provide panelists with access to the proposals at the beginning of the panel meeting, allowing them a period of time during which they prepare their reviews at the meeting.
Many proposals submitted to NSF are reviewed using some combination of
these two processes ("mail-plus-panel" review). Those programs that employ
the mail-plus-panel review process have developed several different configurations,
such as:
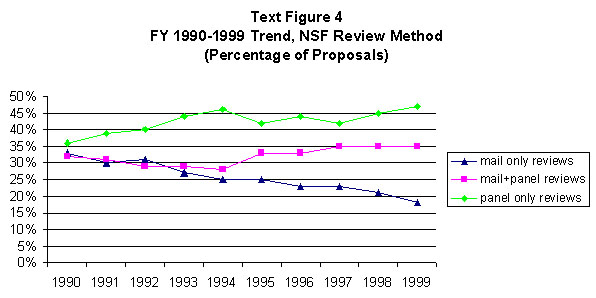
The use of various review processes has changed markedly over time. The percentage of NSF proposals reviewed by panel-only has increased from 36 to 47 percent of all proposals since FY 1990. There has been a steady decline in the use of mail-only review from 33 to 18 percent during the past decade. The use of mail-plus-panel review increased from 32 to 35 percent during the past ten years. These trends are shown in Text Figure 4, and the corresponding data are presented in Appendix Table 4. These trends most likely result from the increasing complexity and multidisciplinarity of proposals and the need to better manage the proposal workload.
Directorate-level data on the use of different review processes during FY 1999 are presented in Appendix Table 5. Directorates vary in their use of proposal review methods. Mail-plus-panel review was the most common review process used in the BIO, GEO, and SBE Directorates. Mail-only review was the predominant mode of review in MPS.
Panel-only review was the most commonly used method in CISE, ENG and EHR. These trends have major implications for the way NSF conducts its business. For example, as indicated in Text Figure 5, there is a strong relationship between time to decision and type of review. In FY 1999, 65% of all proposals reviewed by panel-only were processed within six months, compared to 54% for mail-plus-panel and 50% for mail-only.
Reviews and Reviewers
NSF policy states that each recommendation for final action on a proposal
must be accompanied by at least three external reviews, unless the requirement
has been waived under special circumstances (see, "Exemptions to the Merit
Review Process," below). The total numbers of reviews and the average
numbers of reviews per proposal obtained by these different methods are
presented in Text Figure 6. Some of this difference is reflected
in the fact that panel counts refer to all the participants on a given
panel, not just the lead reviewers.
Directorate-level data for FY 1999 are presented in Appendix Table 6. There is considerable variation in the number of reviews per proposal among the directorates, ranging from 15.7 (BIO) to 4.0 (ENG).
A growing number of reviews are submitted electronically through NSF's FastLane system. Of the 246,145 reviews submitted in FY 1999, 74,891, or 30 percent, were submitted through FastLane. In the first three months of FY 2000, 27,040 proposals were submitted through FastLane, compared to 11,648 for the same period in FY 1999. FastLane promises considerable workload reduction for both the reviewer community and the NSF staff.
Diversity of the reviewer pool is an important feature of the NSF merit review system. Reviewers from diverse backgrounds help ensure that a wide range of perspectives are taken into consideration in the review process. NSF emphasizes reviewer diversity through a variety of processes, including use of a large and expanding Foundation-wide reviewer database, explicit policy guidance, mandatory training for all program officers, and directorate-level initiatives.
NSF maintains a central electronic database of about 250,000 reviewers. For proposal decisions in FY 1999, 47,300 of these reviewers were sent one or more proposals for mail review, 30,700 reviewed at least one proposal by mail, and 8,300, reviewers served as panelists. In all, 51,900 individuals either served on a panel, were sent a proposal for mail review, or served in both functions. Of these reviewers, 16 percent were female, 77 percent were male, and for 7 percent the gender was unknown. The data for minorities is not of sufficient quality to publish.
Potential reviewers are identified from a variety of sources including applicant suggestions, references attached to proposals and published papers, and input from mail reviewers, panelists, and visiting scientists. During FY 1999, approximately 29,400 of the 250,000 records now in the reviewer database were either added or updated.
Participation in the peer review process is voluntary. Panelists are reimbursed for expenses; mail reviewers receive no financial compensation. In FY 1999, 59 percent of requests for mail reviews produced responses, which represents a decrease from the 62 percent response rate in FY 1998 and the 64 percent response rate that had been stable since 1991.
Reviewer Proposal Ratings
The NSF merit review system emphasizes reviewer narratives over summary
ratings. Summary ratings are but one indicator of reviewer judgment of
the proposal quality. The written narratives provided by reviewers, the
deliberations by panel members, and the expert opinions provided by program
officers are all important components of the merit review system. No one
component is allowed to dominate over the others.
The distribution of average summary ratings of reviews for awarded and declined proposals is provided in Text Figure 7. Only those ratings provided for mail-only and mail-plus-panel reviewers have been included. Panel-only reviewers often submit comments without a summary rating. These data indicate considerable overlap among the average reviewer ratings of successful and unsuccessful proposals, most notably in the range of "very good" average ratings. The judgment of NSF staff is essential to making this difficult separation between awards and declines. The data also indicate that a large number of potentially fundable proposals are declined each year.

NOTE: Excludes reviews Submitted as written comments.
NSF Program Officers
The narrative comments and summary ratings provided by external reviewers
are essential inputs in NSF's system of merit review. Once received, these
inputs inform the judgment of the program officers who formulate award
and decline recommendations to NSF's senior management. These program
officers are scientists, engineers, and educators to whom NSF looks for
expert judgment and program management. In making recommendations to award
or decline proposals, these highly qualified individuals produce and manage
a portfolio of awards addressing NSF's strategic goals and related factors
such as:
The number of program officers employed by NSF has remained stable at around 400 for the past five years, despite increases in proposal complexity and general workload. Depending on their professional experience, program officers are classified as assistant program director, associate program director, or program director. They can be permanent NSF employees or temporary employees. Some temporary program officers are "on loan" as visiting scientists, engineers, and educators (VSEEs) for up to three years from their host institutions. Others are employed through grants to the home institutions under the terms of the Intergovernmental Personnel Act. The distribution of these program officers among these and other categories is presented in Text Figure 8.
Assuring Objectivity in the Merit Review Process
NSF program officers carefully check all proposals for potential conflict-of-interest
and select expert outside reviewers with no apparent potential conflicts.
All reviewers are instructed to declare potential conflicts. All program
officers receive conflicts-of-interest training annually.
NSF policy includes several mechanisms that provide proposers with information on how the review process led to a recommendation, and on procedures for obtaining additional explanations for declinations. These policies help to ensure that NSF's review has been fair and reasonable, and that NSF maintains the openness, quality, and integrity of the merit review process.
Every proposer receives from the NSF program officer a description of the context in which the proposal was reviewed, along with an anonymous verbatim copy of each review that was considered in the review process. A declined PI may ask the cognizant program officer for additional clarification of the decision. If after considering this additional information a PI is not satisfied that the proposal was fairly handled and reasonably reviewed, he or she may request formal reconsideration from the cognizant Assistant Director (AD). This request can be based on the PI's perception of procedural errors or on disagreements over the substantive issues dealt with by reviewers. If the AD upholds the original action, the applicant's institution may request a second reconsideration from the Foundation's Deputy Director (O/DD).
On average, NSF annually declines over 20,000 proposals but receives, on average, only 40-50 requests for formal reconsideration. Most program-level decisions are upheld in the reconsideration process. Out of the 240 requests for formal reconsideration of declined proposals during the past six years, nine decisions have been reversed. The number of requests for formal reconsideration and resulting decisions at both the AD and O/DD levels from FY 1994 through FY 1999 are displayed in Appendix Table 7.
Each program officer's recommendation to award or decline a proposal is subject to a programmatic review by a higher level reviewing official (usually the division director), and an administrative review by a grants officer in the Office of Budget, Finance, and Award Management (BFA). All award recommendations in excess of $1.5 million in any one project year or $6 million over five years must be reviewed by the Director's Review Board (DRB). In FY 1999, awards in excess of a $3 million commitment during a project year, or $15 million over five years, required approval by the National Science Board.
Changes to the NSB threshold were approved by the NSB in July, 1999 and implemented on September 30, 1999, effective Fiscal Year 2000. The new threshold requires NSB approval of awards where the average annual award amount is 1% or more of the awarding directorate's prior year current plan.
![]()
Committees of Visitors (COV)
NSF regularly assesses performance of all aspects of the merit review
system, comparing its efficiency, effectiveness, customer satisfaction
and integrity against similar processes run by other organizations. For
example, panels of external experts called Committees of Visitors (COVs)
are convened to review the technical and managerial stewardship of NSF
programs on a three-year cycle. COVs report on the integrity and efficiency
of the processes for proposal review and the quality of results of NSF's
programs in the form of outputs and outcomes that appear over time. The
recommendations of COVs are reviewed by management and taken into consideration
by NSF when evaluating existing programs and future directions for the
Foundation.
In FY 1999, NSF's activities were organized into nearly 200 programs. In FY 1999, a total of 18 committees of visitors (COVs) met to conduct reviews of 82 programs, producing a total of 43 COV reports assessing the quality of program performance and outcome results. The number of COV reports is greater than the number of COVs because the COVs were organized into subgroups to produce reports covering more than one program. A list of all programs subject to review by a Committee of Visitors and the fiscal year of the most recent review is provided in Appendix Table 10.
Each COV must operate in accordance with the Federal Advisory Committee Act (FACA) of 1972. In compliance with FACA regulations, virtually all COVs are established as subcommittees of an existing chartered directorate advisory committee, and the COV report is reviewed and approved by the parent advisory committee. The cognizant assistant director (AD) provides the parent advisory committee with a written response to each COV report. The COV's report and the AD's response are public documents; some have been publicized in the professional literature.
Government Performance and Results Act (GPRA)
The merit review system is at the very heart of NSF's selection of the
projects through which its GPRA outcome goals are achieved. Hence, in
NSF's new GPRA Strategic Plan, "operating a credible, efficient merit
review system" is cited as a critical factor for success of the agency.
Ensuring a credible, efficient system requires constant attention and
openness to change. Two implementation strategies for accomplishing this
are: (1) Regularly assess performance of all aspects of the merit review
system, comparing its efficiency, effectiveness, customer satisfaction
and integrity against similar processes run by other organizations; and
(2) Promote the use of both merit review criteria (i.e. intellectual
merit and broader impacts) in the evaluation of proposals.
In the FY 1999 GPRA Performance Plan, NSF's investment process goals focus on the means and strategies the Foundation uses to make investment decisions and shape its portfolio of awards in order to achieve its mission and desired outcome goals. Two of these goals (goals 6&7, described below) specifically addressed the use of merit review.
Goal 6: At least 90% of NSF funds will be allocated to projects reviewed by appropriate peers external to NSF and selected through a merit-based competitive process. (This is a government-wide goal for all federal science, space and technology funding agencies.)
Results: In FY 1999 NSF exceeded this goal, with 95% of project funds allocated to projects subjected to merit review. This goal will be maintained in FY 2000. NSF expects to exceed this government-wide goal again.
Goal 7: NSF performance in implementation of the new merit review criteria
Background: In 1997 the NSB approved new NSF merit review criteria. The two new review criteria are (1) What is the intellectual merit of the proposed activity; and (2) What are the broader impacts of the proposed activity? The guidance accompanying the new review criteria state that both criteria must be addressed in the evaluation of a proposal.
NSF's performance goal for the implementation of the new merit review criteria is stated in the alternative (narrative) GPRA format. NSF performance is:
Results: Largely successful, needs some improvement. For FY 1999, Committees of Visitors (COV's) and Advisory Committees (AC's) used the alternative format to judge how well NSF is implementing the new criteria. In FY 1999, a total of 38 COV reports and 6 AC reports rated NSF programs on their use of the new merit review criteria. NSF was rated successful in achieving this goal in 33 COV reports and 3 AC reports.
One AC report gives NSF a qualified successful rating, and two AC reports rate NSF minimally effective in implementing this goal. In most cases where NSF was not fully successful, it was found that reviewers and applicants were not fully addressing both review criteria. This goal will be maintained for FY 2000.
Recent Progress: NSF has established guidelines in program announcements requiring applicants and reviewers to address these criteria in proposals and reviews. NSF has recently re-issued guidance to the applicants and reviewers, stressing the importance of using both criteria in the preparation and evaluation of proposals submitted to NSF. NSF is also taking additional steps to ensure that applicants address these criteria when reporting project results.
As part of the FY 1999 Performance Plan, the following language was added to NSF program announcements and included in the Grant Proposal Guide:
PIs should address the following elements in their proposal to provide reviewers with the information necessary to respond fully to the above-described NSF merit review criteria. NSF staff will give these elements careful consideration in making funding decisions.
Integration of Research and Education
One of the principal strategies in support of NSF's goals is to foster integration of research and education through the programs, projects and activities it supports at academic and research institutions. These institutions provide abundant opportunities where individuals may concurrently assume responsibilities as researchers, educators, and students, and where all can engage in joint efforts that infuse education with the excitement of discovery and enrich research through the diversity of learning perspectives.
Integrating Diversity into NSF Programs, Projects, and Activities
Broadening opportunities and enabling the participation of all citizens -- women and men, underrepresented minorities, and persons with disabilities -- are essential to the health and vitality of science and engineering. NSF is committed to this principle of diversity and deems it central to the programs, projects, and activities it considers and supports.
Use of Preliminary Proposals
The use of preliminary proposals has increased in frequency over the past
several years in NSF programs. The intent of preliminary proposals is
to limit the burden imposed on proposers, reviewers and NSF staff. Normally,
preliminary proposals require only enough information to make fair and
reasonable decisions regarding encouragement/discouragement of a full
proposal. In FY 1999, NSF acted on 1,594 preliminary proposals that were
officially logged into the proposal processing system. Of these, NSF encouraged
the submission of full proposals in 221 cases and discouraged submission
in 1,373 cases. Until now, there have not been NSF-wide policies for the
use, review and tracking of preliminary proposals. However, the establishment
of such policies is currently under discussion.
Cost Sharing Policy Revision In accordance with Congressional requirements, NSF requires that each grantee share in the cost of NSF research projects resulting from unsolicited proposals. In addition to the statutory requirements, NSF can require cost sharing when it believes there is tangible benefit to the award recipient(s) (normally beyond the immediate term or scope of the NSF-supported activity).
In FY 1999, NSF revised its policy with respect to cost sharing. It took effect on 7 May 1999, when approved by the National Science Board. The revised policy set forth the following principle for how non-statutory cost sharing may be used as an eligibility factor in the receipt of proposals.
NSF cost sharing requirements beyond the statutory requirement will be clearly stated in the program announcement, solicitation or other mechanism, which generates proposals to the program. NSF-required cost sharing is considered an eligibility rather than review criterion.
This obviously has important implications for the proposal solicitation process and its implementation will be closely monitored. A new system to automate proposal solicitation preparation has helped support the use of clear, consistent language in this area.
Small Grants for Exploratory Research (SGER)
Since the beginning of FY 1990, the Small Grants for Exploratory Research
(SGER) option has permitted program officers throughout the Foundation
to make short-term (one to two years), small-scale (less than $50 K) grants
without formal external review. Characteristics of activities that
can be supported by an SGER award include:
The SGER funding rate is much higher than for regular, competitively reviewed proposals in large part because potential SGER applicants are encouraged to contact an NSF program officer before submitting an SGER proposal to determine its appropriateness for the SGER funding option. As potential SGER applicants have become familiar with this practice, the SGER funding rate has increased from 55 percent in its first year (FY 1990) to 81 percent in FY 1999. Additional details are shown in Text Figure 9.
|
Text Figure 9 Fiscal Years |
||||||||
| 1992 | 1993 | 1994 | 1995 | 1996 | 1997 | 1998 | 1999 | |
|---|---|---|---|---|---|---|---|---|
| Proposals | 330 | 309 | 258 | 228 | 205 | 244 | 302 | 277 |
| Awards | 194 | 213 | 185 | 168 | 144 | 194 | 250 | 223 |
| Funding Rate (%) | 65 | 69 | 72 | 74 | 70 | 80 | 83 | 81 |
NSF management has been concerned by the decrease in SGER proposal pressure since the activity's inception in 1990. In response, Staff Memorandum O/D 97-06 (dated June 5, 1997) announced a three-year experiment that increases the SGER award limit from $50,000 to $100,000. Program officers were also given permission to grant six-month extensions and supplements of up to $50,000 for extant SGER awards. (EHR and BIO elected not to offer these time extensions or supplements.)
Coincident with these policy changes, the downward trends in SGER proposal pressure and number of awards were reversed in FY 1998. NSF received 244 SGER proposals in FY 1997 and made 194 awards. NSF received 302 SGER proposals in FY 1998 and made 250 awards. Directorates vary in the degree to which their program officers discourage potential proposers from submitting inappropriate ideas as formal SGER proposals. As a result, FY 1998 funding rates for SGER proposals varied among directorates from 47 to 94 percent. Directorate-level data on SGER proposal pressure and funding rates are presented in Appendix Table 8.
The total amount awarded to SGERs in FY 1999 was $12,293,477. The average SGER award amount in FY 1999 was $55,128, a 27 percent increase relative to the FY 1997 average award amount of $43,367. Despite these increases, the total NSF investment in SGERs remains less than one half of one percent of the operating budget for research and education, far below the five percent that program officers may commit to SGER awards. The history of SGER awards by directorate from FY 1997 to FY 1999 is presented in Appendix Table 9.
Accomplishment Based Renewals and Creativity Extensions
In addition to SGERs, NSF program officers may recommend accomplishment
based renewals and creativity extensions.
An accomplishment-based renewal is a method that can be used by PIs to submit renewal proposals to NSF. In this type of renewal proposal, the project description is replaced by copies of no more than six reprints of publications resulting from the research supported by NSF (or research supported by other sources that is closely related to the NSF-supported research) during the preceding three- to five-year period. Of the six publications, two preprints (accepted for publication) may be included. In addition, a brief (not to exceed four pages) summary of plans for the proposed support period must be submitted. All other information required for NSF proposal submission remains the same.
A creativity extension is an extension of funding for up to two years for certain research grants. The objective of such extensions is to offer the most creative investigators an extended opportunity to attack adventurous, "high-risk" opportunities in the same general research area, but not necessarily covered by the original/current proposal. Special Creativity Extensions are initiated by the NSF Program Officer based on progress during the first two years of a three-year grant.
In 1999 there were 30 requests for accomplishment based renewals, 15 of which were awarded. There were also 48 creativity based extensions made to existing NSF grants.
Exemptions to the Merit Review Process
Authorized exemptions to the peer review process are listed in NSF Manual
10, Section 122 (Attachment I) and include
routine award actions such as continuing grant increments and no-cost
extensions. In special circumstances, the Director or designee may waive
peer review requirements. Such waivers of peer review were granted 7 times
during FY 1999; 5 for OIA, 1 for SBE and 1 for CISE.
![]()
Appendix Table 1
Competitively Reviewed Proposals, Awards and Funding Rates
By Directorate, FY 1994 � 1998
| Fiscal Year | Five-year Total |
Five-year Average |
||||||
|---|---|---|---|---|---|---|---|---|
| 1995 | 1996 | 1997 | 1998 | 1999 | ||||
| NSF | Proposals |
30,700 | 30,231 | 30,189 | 28,318 | 28,504 | 147,942 | 29,588 |
| Awards | 9,563 | 9,071 | 9,864 | 9,279 | 9,112 | 46,889 | 9,378 | |
| Funding Rate | 31% | 30% | 33% | 33% | 32% | 32% | 32% | |
| BIO | Proposals | 5,255 | 5,676 | 5,209 | 4,857 | 4,711 | 25,708 | 5,142 |
| Awards | 1,383 | 1,328 | 1,416 | 1,404 | 1,370 | 6,901 | 1,380 | |
| Funding Rate | 26% | 23% | 27% | 29% | 29% | 27% | 27% | |
| CSE | Proposals | 2,067 | 1,931 | 2,010 | 2,035 | 2,255 | 10,298 | 2,060 |
| Awards | 722 | 647 | 631 | 706 | 759 | 3,565 | 713 | |
| Funding Rate | 35% | 34% | 36% | 35% | 34% | 35% | 35% | |
| EHR | Proposals | 4,979 | 3,732 | 3,369 | 3,508 | 2,827 | 18,415 | 3,683 |
| Awards | 1,475 | 1,326 | 1,191 | 1,212 | 809 | 6,013 | 1,203 | |
| Funding Rate | 30% | 36% | 35% | 35% | 29% | 33% | 33% | |
| ENG | Proposals | 5,740 | 5,956 | 6,076 | 5,589 | 5,475 | 28,836 | 5,767 |
| Awards | 1,473 | 1,383 | 1,573 | 1,390 | 1,483 | 7,302 | 1,460 | |
| Funding Rate | 26% | 23% | 26% | 25% | 27% | 25% | 25% | |
| GEO | Proposals | 3,421 | 3,723 | 3,950 | 3,317 | 3,435 | 17,846 | 3,569 |
| Awards | 1,199 | 1,161 | 1,337 | 1,227 | 1,312 | 6,236 | 1,247 | |
| Funding Rate | 35% | 31% | 34% | 37% | 38% | 35% | 35% | |
| MPS | Proposals | 5,203 | 4,958 | 5,536 | 5,265 | 5,177 | 25,139 | 5,228 |
| Awards | 1,864 | 1,817 | 1,993 | 1,835 | 1,891 | 9,400 | 1,880 | |
| Funding Rate | 36% | 37% | 36% | 35% | 37% | 36% | 36% | |
| SBE | Proposals | 3,490 | 3,453 | 3,286 | 3,091 | 3,909 | 17,229 | 3,446 |
| Awards | 1,149 | 1,137 | 1,223 | 1,262 | 1,190 | 5,961 | 1,192 | |
| Funding Rate | 33% | 33% | 37% | 41% | 30% | 35% | 35% | |
| Other | Proposals | 545 | 802 | 753 | 656 | 715 | 3,471 | 694 |
| Awards | 298 | 272 | 400 | 243 | 298 | 1,511 | 302 | |
| Funding Rate | 55% | 34% | 53% | 37% | 42% | 44% | 44% | |
Source: NSF Enterprise Information System, as of December 15, 1999
![]()
Competitively Reviewed Proposals, Awards and Funding
Rates
By PI Characteristics, FY 1992-1999
|
Fiscal Year |
|||||||||
|---|---|---|---|---|---|---|---|---|---|
| 1991 | 1992 | 1993 | 1994 | 1995 | 1996 | 1997 | 1998 | ||
| All PIs | Proposals | 30,320 | 30,003 | 30,399 | 30,700 | 30,231 | 30,189 | 28,318 | 28,504 |
| Awards | 10,356 | 9,148 | 9,976 | 9,563 | 9,071 | 9,864 | 9,279 | 9,112 | |
| Funding Rate | 34% | 33% | 33% | 31% | 30% | 33% | 33% | 32% | |
| Female PIs | Proposals | 4,448 | 4,468 | 4,833 | 4,945 | 5,170 | 5,382 | 5,603 | 5,292 |
| Awards | 1,519 | 1,460 | 1,641 | 1,582 | 1,666 | 1,938 | 1,920 | 1,658 | |
| Funding Rate | 34% | 33% | 34% | 32% | 32% | 36% | 34% | 31% | |
| Male PIs | Proposals | 25,334 | 25,137 | 25,023 | 25,151 | 25,712 | 24,448 | 22,379 | 22,935 |
| Awards | 8,503 | 7,563 | 8,018 | 7,633 | 7,292 | 7,793 | 7,219 | 7,365 | |
| Funding Rate | 34% | 30% | 32% | 30% | 30% | 32% | 32% | 32% | |
| Minority PIs | Proposals | 1,481 | 1,408 | 1,449 | 1,521 | 1,527 | 1,452 | 1,377 | 1,418 |
| Awards | 469 | 391 | 422 | 422 | 472 | 459 | 408 | 430 | |
| Funding Rate | 32% | 28% | 29% | 28% | 31% | 32% | 30% | 30% | |
| New PIs | Proposals | 14,988 | 14,284 | 14,566 | 14,192 | 13,630 | 13,267 | 12,204 | 11,831 |
| Awards | 3,735 | 3,025 | 3,598 | 3,367 | 3,021 | 3,264 | 3,041 | 2,675 | |
| Funding Rate | 25% | 21% | 25% | 24% | 22% | 25% | 25% | 23% | |
| Prior PIs | Proposals | 15,332 | 15,719 | 15,833 | 16,508 | 16,601 | 16,922 | 16,114 | 16,673 |
| Awards | 6,621 | 6,123 | 6,378 | 6,196 | 6,050 | 6,600 | 6,238 | 6,437 | |
| Funding Rate | 43% | 39% | 40% | 38% | 36% | 39% | 39% | 39% | |
Notes:
"Competitively reviewed" proposals and awards are actions for research,
education and training processed through NSF's merit review system each
year.
"Gender" is based on self-reported information from the PI's most recent
proposal.
"Minority" is based on the PI's ethnic/racial status as reported to NSF
on the most recent proposal. PIs can decline to report their ethnic/racial
status. Includes American Indian, Alaskan Native, Black, Hispanic, and
Pacific Islander and excludes Asian and White-Not of Hispanic Origin.
Source: NSF Enterprise Information System, as of December 15, 1999
![]()
Median and Average Award Amounts by Directorate
Research Grants
FY 1995 - 1999
| Fiscal Year | ||||||
|---|---|---|---|---|---|---|
| 1995 | 1996 | 1997 | 1998 | 1999 | ||
| NSF | Median | $59,468 | $61,744 | $67,000 | $70,854 | $73,335 |
| Average | $72,798 | $75,613 | $82,256 | $89,854 | $92,788 | |
| BIO | Median | $76,667 | $76,604 | $85,819 | $90,000 | $94,078 |
| Average | $82,960 | $84,415 | $89,670 | $103,327 | $125,901 | |
| CSE | Median | $55,395 | $57,788 | $74,450 | $75,000 | $82,850 |
| Average | $76,283 | $86,721 | $93,634 | $99,014 | $108,661 | |
| ENG | Median | $62,087 | $68,870 | $70,000 | $473,122 | $73,547 |
| Average | $69,433 | $73,168 | $77,864 | $86,879 | $84,594 | |
| GEO | Median | $61,821 | $62,635 | $66,516 | $69,468 | $66,796 |
| Average | $75,859 | $80,467 | $80,182 | $86,747 | $85,609 | |
| MPS | Median | $55,833 | $60,000 | $65,000 | $73,670 | $77,139 |
| Average | $80,487 | $82,000 | $91,409 | $94,559 | $93,591 | |
| SBE | Median | $33,973 | $27,471 | $32,278 | $37,387 | $39,493 |
| Average | $42,068 | $37,404 | $46,673 | $51,807 | $49,481 | |
| O/D | Median | $61,466 | $76,358 | $75,634 | $85,575 | $81,096 |
| Average | $80,826 | $95,434 | $103,259 | $111,461 | $112,671 | |
Note: Median and average are based on competitively reviewed
research awards.
Source: NSF Enterprise Information System, as of February
7, 2000.
![]()
Methods of NSF Proposal
Review
FY 1990 - 1999
| Total Proposals |
Mail + Panel | Mail-Only | Panel-Only | ||||
|---|---|---|---|---|---|---|---|
| FY | Proposals | Percent | Proposals | Percent | Proposals | Percent | |
| 1999 | 29,564 | 10,324 | 35% | 5,292 | 18% | 13,948 | 47% |
| 1998 | 28,492 | 9,883 | 35% | 5,890 | 21% | 12,719 | 45% |
| 1997 | 29,467 | 10,334 | 35% | 6,718 | 23% | 12,415 | 42% |
| 1996 | 29,595 | 9,853 | 33% | 6,853 | 23% | 12,889 | 44% |
| 1995 | 30,096 | 9,844 | 33% | 7,540 | 25% | 12,712 | 42% |
| 1994 | 29,869 | 8,499 | 28% | 7,582 | 25% | 13,788 | 46% |
| 1993 | 28,956 | 8,401 | 29% | 7,949 | 27% | 12,606 | 44% |
| 1992 | 28,938 | 8,484 | 29% | 8,970 | 31% | 11,484 | 40% |
| 1991 | 27,945 | 8,602 | 31% | 8,307 | 30% | 11,036 | 39% |
| 1990 | 27,987 | 8,834 | 32% | 9,099 | 33% | 10,054 | 36% |
Note: "O/D" includes the Office
of Polar Programs and the Office of Integrative Activities. Panel-Only
includes cases where panelist was mailed proposal for review prior to
panel. FY
1999 numbers includes 1,570 reviewed preproposals.
Source: NSF Enterprise Information System, as of December 15, 1999.
![]()
Methods of NSF Proposal
Review
By Directorate, FY 1999
| Total Proposals |
Mail + Panel | Mail-Only | Panel-Only | ||||
|---|---|---|---|---|---|---|---|
| Directorate | Proposals | Percent | Proposals | Percent | Proposals | Percent | |
| NSF | 29,564 | 10,324 | 35% | 5,292 | 18% | 13,948 | 47% |
| BIO | 4,622 | 3,398 | 74% | 99 | 2% | 1,125 | 24% |
| CSE | 2,287 | 412 | 18% | 158 | 7% | 1,717 | 75% |
| EHR | 3,364 | 111 | 3% | 103 | 3% | 3,150 | 94% |
| ENG | 5,626 | 456 | 8% | 813 | 14% | 4,357 | 77% |
| GEO | 3,401 | 2,457 | 72% | 649 | 19% | 295 | 9% |
| MPS | 5,136 | 1,230 | 24% | 2,521 | 49% | 1,385 | 27% |
| SBE | 3,880 | 1,853 | 48% | 730 | 19% | 1,297 | 33% |
| Other | 1,248 | 407 | 33% | 219 | 18% | 622 | 50% |
Note: "Other" includes the Office of Polar Programs and the Office of Integrative Activities. Panel-Only includes cases where panelist was mailed proposal for review prior to panel. FY 1999 numbers includes 1,570 reviewed preproposals.
Source: NSF Enterprise Information System, as of December 15,1999.
![]()
Average Number of Reviews
per Proposal
By Method and Directorate, FY 1999
| Methods of Review | |||||
|---|---|---|---|---|---|
| Directorate | All Methods | Mail+Panel | Mail-Only | Panel-Only | |
| BIO | Reviews | 72,736 | 57,157 | 474 | 15,105 |
| Proposals | 4,622 | 3,398 | 99 | 1,125 | |
| Rev/Prop | 15.7 | 16.8 | 4.8 | 13.4 | |
| CSE | Reviews | 11,727 | 2,635 | 645 | 8,447 |
| Proposals | 2,287 | 412 | 158 | 1,717 | |
| Rev/Prop | 5.1 | 6.4 | 4.1 | 4.9 | |
| EHR | Reviews | 19,664 | 777 | 428 | 18,459 |
| Proposals | 3,364 | 111 | 103 | 3,150 | |
| Rev/Prop | 5.8 | 7.0 | 4.2 | 5.9 | |
| ENG | Reviews | 22,521 | 2,506 | 3,439 | 16,576 |
| Proposals | 5,626 | 456 | 813 | 4,357 | |
| Rev/Prop | 4.0 | 5.5 | 4.2 | 3.8 | |
| GEO | Reviews | 36,709 | 31,042 | 3,410 | 2,257 |
| Proposals | 3,401 | 2,457 | 649 | 295 | |
| Rev/Prop | 10.8 | 12.6 | 5.3 | 7.7 | |
| MPS | Reviews | 37,306 | 12,266 | 12,052 | 12,988 |
| Proposals | 5,136 | 1,230 | 2,521 | 1,385 | |
| Rev/Prop | 7.3 | 10.0 | 4.8 | 9.4 | |
| SBE | Reviews | 37,883 | 21,865 | 2,722 | 13,296 |
| Proposals | 3,880 | 1,853 | 730 | 1,297 | |
| Rev/Prop | 9.8 | 11.8 | 3.7 | 10.3 | |
| O/D | Reviews | 7,599 | 3,821 | 992 | 2,786 |
| Proposals | 1,248 | 407 | 219 | 622 | |
| Rev/Prop | 6.1 | 9.4 | 4.5 | 4.5 | |
Notes:
Peers participating as both a mail and panel reviewer for the same proposal
are counted as one review in this table.
Source: NSF Enterprise Information System, as of December 15, 1999.
FY 1999 numbers includes 1,570 reviewed preproposals, 1,554 were reviewed by panel and 16 by mail.
![]()
Requests for Formal Reconsideration
of Declined Proposals
By Directorate, FY 1994 - 1999
| Fiscal Year | |||||||
|---|---|---|---|---|---|---|---|
| 1994 | 1995 | 1996 | 1997 | 1998 | 1999 | ||
| First Level Reviews (by Assistant Directors): | |||||||
| NSF | Requests | 28 | 38 | 46 | 39 | 53 | 36 |
| - Upheld | 30 | 37 | 45 | 34 | 48 | 34 | |
| - Reversed | 0 | 1 | 1 | 4 | 3 | 0 | |
| BIO | Requests | 5 | 4 | 3 | 4 | 6 | 4 |
| - Upheld | 5 | 4 | 3 | 2 | 6 | 4 | |
| - Reversed | 0 | 0 | 0 | 2 | 0 | 0 | |
| CSE | Requests | 0 | 3 | 1 | 2 | 3 | 1 |
| - Upheld | 0 | 3 | 1 | 2 | 3 | 1 | |
| - Reversed | 0 | 0 | 0 | 0 | 0 | 0 | |
| EHR | Requests | 4 | 3 | 8 | 4 | 6 | 3 |
| - Upheld | 6 | 3 | 8 | 4 | 5 | 3 | |
| - Reversed | 0 | 0 | 0 | 0 | 1 | 0 | |
| ENG | Requests | 6 | 3 | 5 | 9 | 5 | 4 |
| - Upheld | 6 | 3 | 5 | 9 | 4 | 4 | |
| - Reversed | 0 | 0 | 0 | 0 | 0 | 0 | |
| GEO | Requests | 5 | 5 | 4 | 2 | 2 | 2 |
| - Upheld | 5 | 5 | 4 | 2 | 2 | 1 | |
| - Reversed | 0 | 0 | 0 | 0 | 0 | 0 | |
| MPS | Requests | 8 | 18 | 20 | 17 | 25 | 20 |
| - Upheld | 8 | 17 | 19 | 15 | 22 | 19 | |
| - Reversed | 0 | 1 | 1 | 2 | 2 | 0 | |
| SBE | Requests | 0 | 2 | 1 | 2 | 3 | 0 |
| - Upheld | 0 | 2 | 1 | 1 | 3 | 1 | |
| - Reversed | 0 | 0 | 0 | 0 | 0 | 0 | |
| Other | Requests | 0 | 0 | 4 | 0 | 0 | 0 |
| - Upheld | 0 | 0 | 4 | 0 | 0 | 0 | |
| - Reversed | 0 | 0 | 0 | 0 | 0 | 0 | |
| Second Level Reviews (by Deputy Director): | |||||||
| O/DD | Requests | 8 | 11 | 7 | 4 | 3 | 2 |
| - Upheld | 9 | 10 | 7 | 4 | 3 | 1 | |
| - Reversed | 0 | 0 | 0 | 0 | 0 | 0 | |
Notes: The number of decisions (upheld or reversed) may not equal the number of requests in each year due to carryover of pending reconsideration request.
Source: Office of the Director
![]()
Small Grants for Exploratory Research
(SGER)
Proposals, Awards and Funding Rates
By Directorate, FY 1992-1999
| Fiscal Year | Eight-year Total |
Eight-year Average |
|||||||||
|---|---|---|---|---|---|---|---|---|---|---|---|
| 1992 | 1993 | 1994 | 1995 | 1996 | 1997 | 1998 | 1999 | ||||
| NSF | Proposals | 300 | 309 | 258 | 228 | 205 | 244 | 302 | 277 | 2,123 | 265 |
| Awards | 194 | 213 | 185 | 168 | 144 | 194 | 250 | 223 | 1,571 | 196 | |
| Funding Rate | 65% | 69% | 72% | 74% | 70% | 80% | 83% | 81% | 74% | 74% | |
| BIO | Proposals | 81 | 80 | 63 | 56 | 50 | 44 | 59 | 48 | 481 | 60 |
| Awards | 39 | 57 | 39 | 40 | 28 | 29 | 48 | 36 | 316 | 40 | |
| Funding Rate | 48% | 71% | 62% | 71% | 56% | 66% | 81% | 75% | 66% | 66% | |
| CSE | Proposals | 14 | 15 | 11 | 18 | 22 | 23 | 21 | 24 | 148 | 19 |
| Awards | 9 | 11 | 9 | 18 | 19 | 23 | 20 | 22 | 131 | 16 | |
| Funding Rate | 63% | 73% | 82% | 100% | 86% | 100% | 95% | 92% | 89% | 89% | |
| EHR | Proposals | 1 | 9 | 5 | 5 | 1 | 7 | 9 | 15 | 52 | 7 |
| Awards | 1 | 9 | 5 | 5 | 1 | 6 | 8 | 14 | 49 | 6 | |
| Funding Rate | 100% | 100% | 100% | 100% | 100% | 86% | 89% | 93% | 94% | 94% | |
| ENG | Proposals | 91 | 94 | 83 | 65 | 59 | 68 | 95 | 89 | 644 | 81 |
| Awards | 69 | 67 | 61 | 52 | 45 | 57 | 72 | 75 | 498 | 62 | |
| Funding Rate | 76% | 71% | 73% | 80% | 76% | 84% | 76% | 84% | 77% | 77% | |
| GEO | Proposals | 44 | 41 | 36 | 28 | 27 | 40 | 56 | 44 | 316 | 40 |
| Awards | 37 | 37 | 33 | 22 | 23 | 38 | 54 | 40 | 284 | 36 | |
| Funding Rate | 84% | 90% | 92% | 79% | 85% | 95% | 96% | 91% | 90% | 90% | |
| MPS | Proposals | 46 | 44 | 42 | 35 | 27 | 32 | 17 | 33 | 2,123 | 265 |
| Awards | 21 | 17 | 25 | 16 | 12 | 13 | 10 | 16 | 130 | 16 | |
| Funding Rate | 46% | 39% | 60% | 46% | 44% | 41% | 59% | 48% | 47% | 47% | |
| SBE | Proposals | 21 | 28 | 12 | 15 | 14 | 19 | 30 | 16 | 155 | 19 |
| Awards | 16 | 17 | 8 | 9 | 11 | 18 | 25 | 12 | 116 | 15 | |
| Funding Rate | 76% | 61% | 67% | 60% | 79% | 95% | 83% | 75% | 75% | 75% | |
| OPP | Proposals | 2 | 7 | 11 | 11 | 6 | 11 | 15 | 8 | 71 | 9 |
| Awards | 2 | 7 | 10 | 11 | 6 | 10 | 13 | 8 | 67 | 8 | |
| Funding Rate | 100% | 100% | 91% | 100% | 100% | 91% | 87% | 100% | 94% | 94% | |
Source: NSF Enterprise Information System, as of January 14, 2000.
![]()
Small Grants for Exploratory Research (SGER)
Funding Trends by Directorate, FY 1997 - 1999
| Fiscal Year | Three-year Total |
||||
|---|---|---|---|---|---|
| 1997 | 1998 | 1999 | |||
| NSF | Total $ | $8,413,152 | $12,320,200 | $12,293,477 | $33,026,829 |
| Awards | 194 | 250 | 223 | 667 | |
| Average $ | $43,367 | $49,281 | $55,128 | $49,515 | |
| BIO | Total $ | $8,413,152 | $12,320,200 | $12,293,477 | $33,026,829 |
| Awards | 194 | 250 | 223 | 667 | |
| Average $ | $43,367 | $49,281 | $55,128 | $49,515 | |
| CSE | Total $ | $8,413,152 | $12,320,200 | $12,293,477 | $33,026,829 |
| Awards | 194 | 250 | 223 | 667 | |
| Average $ | $43,367 | $49,281 | $55,128 | $49,515 | |
| EHR | Total $ | $8,413,152 | $12,320,200 | $12,293,477 | $33,026,829 |
| Awards | 194 | 250 | 223 | 667 | |
| Average $ | $43,367 | $49,281 | $55,128 | $49,515 | |
| ENG | Total $ | $8,413,152 | $12,320,200 | $12,293,477 | $33,026,829 |
| Awards | 194 | 250 | 223 | 667 | |
| Average $ | $43,367 | $49,281 | $55,128 | $49,515 | |
| GEO | Total $ | $8,413,152 | $12,320,200 | $12,293,477 | $33,026,829 |
| Awards | 194 | 250 | 223 | 667 | |
| Average $ | $43,367 | $49,281 | $55,128 | $49,515 | |
| MPS | Total $ | $8,413,152 | $12,320,200 | $12,293,477 | $33,026,829 |
| Awards | 194 | 250 | 223 | 667 | |
| Average $ | $43,367 | $49,281 | $55,128 | $49,515 | |
| SBE | Total $ | $8,413,152 | $12,320,200 | $12,293,477 | $33,026,829 |
| Awards | 194 | 250 | 223 | 667 | |
| Average $ | $43,367 | $49,281 | $55,128 | $49,515 | |
| O/D | Total $ | $8,413,152 | $12,320,200 | $12,293,477 | $33,026,829 |
| Awards | 194 | 250 | 223 | 667 | |
| Average $ | $43,367 | $49,281 | $55,128 | $49,515 | |
Source: NSF Enterprise Information System, as of January 14, 2000.
![]()
Committee of Visitors Meetings
By Directorate
(COV meetings held during FY 1999 are highlighted in bold font)
| Directorate Division Programs |
Fiscal Year of Most Recent COV |
|---|---|
| Biological Sciences | |
| Biological Infrastructure | |
| Instrumentation & Related Activities | 1998 |
| Research Resources (new) | 1999 |
| Training (new) | 1999 |
| Environmental Biology | |
| Ecological Studies | 1999 |
| Systematic & Population Biology | 1999 |
| Integrative Biology & Neuroscience | |
| Neuroscience | 1999 |
| Developmental Mechanisms | 1997 |
| Physiology & Ethology | 1998 |
| Molecular & Cellular Biosciences | |
| Biomolecular Structure & Function | 1998 |
| Biomolecular Processes | 1998 |
| Cell Biology | 1998 |
| Genetics | 1999 |
| Directorate Division Programs |
Fiscal Year of Most Recent COV |
|---|---|
| Computer and Information Science and Engineering | |
| Advanced Computational Infrastructure and Research | |
| Advanced Computational Research | 1998 |
| Partnerships for Advanced Computational Infrastructure | 1999 |
| Computer-Communication Research | |
| Communications | 1998 |
| Computer Systems Architecture | 1996 |
| Design Automation | 1995 |
| Numeric, Symbolic, and Geometric Computation | 1996 |
| Operating Systems and Compilers | 1996 |
| Signal Processing Systems | 1996 |
| Software Engineering and Languages | 1996 |
| Theory of Computing | 1996 |
| Information and Intelligent Systems | |
| Computation and Social Systems | 1999 |
| Human Computer Interaction | 1999 |
| Knowledge and Cognitive Systems | 1999 |
| Robotics & Human Augmentation | 1999 |
| Information and Data Management | 1999 |
| Advanced Networking Infrastructure and Research (was NSFNET) | |
| Networking Research | 1998 |
| Special Projects in Networking Research (new in 1998) | |
| Advanced Networking Infrastructure | 1996 |
| Experimental and Integrative Activities (new in 1998) | |
| Experimental Partnerships (new in 98) | 1996 |
| Research Infrastructure | 1995 |
| Advanced Distributed Resources for Experiments (new in 1998) | |
| Minority Institutional Infrastructure | 1995 |
| Digital Government (new in 1998) | |
| Instrumentation Grants for Research | 1999 |
| Educational Innovation | 1995 |
| Next Generation Software (new in 1998) |
| Directorate Division Programs |
Fiscal Year of Most Recent COV |
|---|---|
| Education and Human Resources | |
| Educational Systemic Reform | |
| Statewide Systemic Initiatives | 1997 |
| Urban Systemic Initiatives | 1999 |
| Rural Systemic Initiatives | 1997 |
| EPSCoR | 1996 |
| Elementary, Secondary & Informal Education | |
| Informal Science Education | 1998 |
| Teacher Enhancement | 1996 |
| Instructional Material Development | 1997 |
| Undergraduate Education | |
| Teacher Preparation | 1997 |
| Advanced Technological Education | 1997 |
| Course, Curriculum, and Laboratory Improvement (new in 1997) | |
| Graduate Education | |
| Graduate Research Fellowships | 1999 |
| NATO Postdoctorate Fellowships | 1997 |
| Presidential Fellowships
for Science, Math, Engineering and Technology Education (new in 1997) |
|
| Graduate Research Traineeship (phases out in 2000) | 1997 |
| Human Resource Development | |
| Alliances for Minority Participation | 1998 |
| Centers for Research Excellence In Science and Technology | 1997 |
| Programs for Women & Girls | 1997 |
| Programs for Persons with Disabilities | 1997 |
| Minority Graduate Education (new in 1998) | |
| Historically Black Colleges and Universities (new in 1998) | |
| Comprehensive Partnerships for Math and Science Achievements | 1998 |
| Research, Evaluation & Communication | |
| Research on Education Policy & Practice (new in 1996) | |
| Evaluation | 1997 |
| Directorate Division Programs |
Fiscal Year of Most Recent COV |
|---|---|
| Engineering | |
| Bioengineering & Environmental Systems | |
| Bioengineering | 1999 |
| Environmental and Ocean Systems | 1999 |
| Civil and Mechanical Systems | |
| Control/Mechanics/Materials | 1999 |
| Construction/Geotechnology/Structures | 1999 |
| Hazard Reduction | 1999 |
| Chemical & Transport Systems | |
| Chemical Reaction Processes | 1997 |
| Interfacial, Transport & Separation Processes | 1997 |
| Fluid, Particulate & Hydraulic Systems | 1997 |
| Thermal Systems | 1997 |
| Design, Manufacture & Industrial Innovation | |
| Operations Research & Production Systems | 1996 |
| Design & Integration Engineering | 1997 |
| Manufacturing Processes & Equipment | 1998 |
| Small Business Innovation Research | 1998 |
| Innovation and Organizational Change | 1996 |
| Special Studies & Analyses | 1996 |
| Grant Opportunities for Academic Liaison with Industry | 1996 |
| Small Business Technology Transfer | 1998 |
| Electrical & Communications Systems | |
| Electronics, Photonics and Device Technologies | 1996 |
| Control, Networks, and Computational Intelligence | 1996 |
| Integrative Systems | 1996 |
| Resource and Infrastructure | 1996 |
| Engineering, Education & Centers | |
| Engineering Education | 1998 |
| Human Resource Development | 1998 |
| Engineering Research Centers | 1998 |
| Industry/Univ. Cooperative Research Centers | 1998 |
| Directorate Division Programs |
Fiscal Year of Most Recent COV |
|---|---|
| Geosciences | |
| Atmospheric Sciences | |
| - Lower Atmosphere Research | |
| Atmospheric Chemistry | 1998 |
| Climate Dynamics | 1998 |
| Meoscale Dynamic Meteorology | 1998 |
| Large-scale Dynamic Meteorology | 1998 |
| Physical Meteorology | 1998 |
| Paleoclimate | 1998 |
| - Upper Atmosphere Research | |
| Magnetospheric Physics | 1999 |
| Aeronomy | 1999 |
| Upper Atmospheric Research Facilities | 1999 |
| Solar Terrestrial Research | 1999 |
| UCAR and Lower Atmospheric Facilities Oversight (includes NCAR) | 1997 |
| Earth Sciences | |
| - Research Grants | |
| Tectonics | 1998 |
| Geology & Paleontology | 1998 |
| Hydrological Sciences | 1998 |
| Petrology & Geochemistry | 1998 |
| - Special Projects | |
| Education & Human Resources | 1997 |
| Instrumentation & Facilities | 1997 |
| Continental Dynamics | 1998 |
| Geophysics | 1998 |
| Ocean Sciences | |
| - Oceanographic Centers & Facilities | |
| Ship Operations | 1994 |
| Oceanographic Facilities | 1994 |
| Ocean Drilling | 1994 |
| Oceanographic Instrumentation & Technical Services | 1994 |
| - Ocean Science Research | |
| Marine Geology & Geophysics | 1998 |
| Biological Oceanography | 1998 |
| Chemical Oceanography | 1998 |
| Physical Oceanography | 1998 |
| Oceanographic Technology & Interdisciplinary Coordination | 1998 |
| Directorate Division Programs |
Fiscal Year of Most Recent COV |
|---|---|
| Mathematical and Physical Sciences | |
| Astronomical Sciences | |
| Planetary Astronomy | 1999 |
| Stellar Astronomy & Astrophysics | 1999 |
| Galactic Astronomy | 1999 |
| Education, Human Resources and Special Programs | 1999 |
| Gemini Telescopes Project | 1999 |
| National Optical Astronomy Observatories (NOAO) | 1999 |
| Advanced Technologies & Instrumentation | 1999 |
| National Radio Astronomy Observatory (NRAO) | 1999 |
| National Astronomy & Ionosphere Center (NAIC) | 1999 |
| University Radio Facilities | 1999 |
| Electromagnetic Spectrum Management | 1999 |
| Chemistry | |
| Special Projects | 1998 |
| Chemical Instrumentation | 1998 |
| Organic & Macromolecular Chemistry | 1998 |
| Organic Dynamics | 1998 |
| Organic Synthesis | 1998 |
| Physical Chemistry | 1998 |
| Theoretical and Computational | 1998 |
| Experimental Physical Chemistry | 1998 |
| Inorganic, Bioinorganic & Organometallic Chemistry | 1998 |
| Analytical & Surface Chemistry | 1998 |
| Materials Research | |
| Condensed Matter Physics | 1999 |
| Materials Theory | 1999 |
| Metals, Ceramics & Electronic Materials | 1999 |
| Solid-State Chemistry & Polymers | 1999 |
| National Facilities & Instrumentation | 1999 |
| Materials Research Science and Engineering Centers | 1999 |
| Mathematical Sciences | |
| Applied Mathematics | 1998 |
| Infrastructure | 1998 |
| Geometric Analysis, Topology and Foundations | 1998 |
| Analysis | 1998 |
| Algebra & Number Theory | 1998 |
| Statistics & Probability | 1998 |
| Physics | |
| Atomic, Molecular and Optical and Plasma Physics | 1997 |
| Elementary Particle Physics | 1997 |
| Theoretical Physics | 1997 |
| Nuclear Physics | 1997 |
| Gravitational Physics | 1997 |
| Directorate Division Programs |
Fiscal Year of Most Recent COV |
|---|---|
| Social, Behavioral and Economic Science | |
| International Programs | 1999 |
| Social, Behavioral & Economic Research | |
| - Economic, Decision & Mgt. Sciences Cluster | |
| Economics | 1997 |
| Decision, Risk & Management Sciences | 1997 |
| Innovation and Organizational Change (new in 1998) | |
| - Anthropology & Geographic Sciences Cluster | |
| Cultural Anthropology | 1999 |
| Physical Anthropology | 1999 |
| Archeology | 1999 |
| Geography | 1999 |
| - Social & Political Science Cluster | |
| Sociology | 1996 |
| Political Science | 1997 |
| Law & Social Science | 1995 |
| - Infrastructure, Methods & Science Studies Cluster | |
| Ethics & Values Studies | 1996 |
| Science & Technology Studies | 1996 |
| Methodology, Measurement & Statistics | 1996 |
| - Cognitive, Psych. & Language Sci. Cluster | |
| Linguistics | 1999 |
| Human Cognition & Perception | 1999 |
| Social Psychology | 1999 |
| Directorate Division Programs |
Fiscal Year of Most Recent COV |
|---|---|
| Office of Polar Programs | |
| Polar Research Support | |
| Polar Operations | 1998 |
| Science Support | 1998 |
| Waste Management | 1998 |
| Facilities | 1998 |
| Safety & Health | 1998 |
| Antarctic Sciences | |
| Aeronomy and Astrophysics | 1997 |
| Biology and Medicine | 1997 |
| Geology and Geophysics | 1997 |
| Glaciology | 1997 |
| Ocean and Climate Systems | 1997 |
| Arctic Sciences | |
| System Sciences | 1997 |
| Natural Sciences | 1997 |
| Social Sciences | 1997 |