
Remarks

Dr. Subra Suresh
Director
National Science Foundation
Biography
Academic and Scientific Community Outreach Event
Edificio de Telefonica
Santiago, Chile
January 11, 2012
Photo by Sandy Schaeffer

Title slide title: Science, Technology, and Globalization
Slide words:
Subra Suresh
Director
National Science Foundation
Academic and Scientific Community Outreach Event
Edificio de Telefonica, Santiago, Chile
January 11, 2011
Slide image: Photo illustration of Earth from space
Image credit: John Prusinski, National Science Foundation
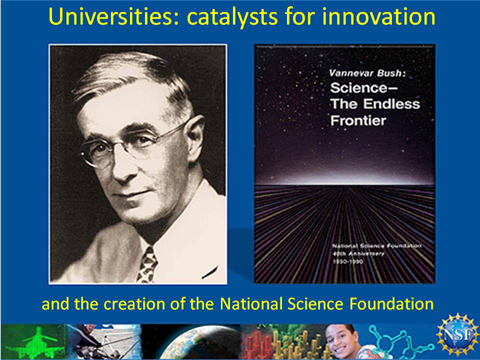
Slide title: Universities: catalysts for innovation
Slide words: and the creation of the National Science Foundation
Slide image: Photograph of Vannevar Bush (left); cover of "Vannevar Bush: Science — The Endless Frontier" (right)
Credit: National Science Foundation
Bottom banner images (left to right): Image of an F4 Phantom fighter jet created with a 3D telepresence system; photo of scientists deploying an apparatus for taking sonar measurements from the seafloor; artist's conception showing the newly discovered planet GJ 581g of the Gliese 581 system; artist's conception of a molecular robot; photo of a fifth-grade student; sketch of RNA molecules
Bottom banner images credits (left to right): University of Arizona; Igor Semiletov, University of Alaska Fairbanks; Lynette Cook; Zina Deretsky, National Science Foundation; Elsa Head, Tufts University; Dr. Jennifer Henke, Princeton University
Slide title: The Innovation Ecosystem in the U.S.
Slide words:
- U.S. has been an engine of scientific and technological innovation for more than 50 years
Slide background image: Photo illustration of Earth from space
Background image credit: John Prusinski, National Science Foundation
Slide title: The Innovation Ecosystem in the U.S.
Slide words:
- U.S. engine of global innovation for more than 50 years
- Magnet for scientific talent from around the globe
Slide background image: Photo illustration of Earth from space
Background image credit: John Prusinski, National Science Foundation
Slide title: The Innovation Ecosystem in the U.S.
Slide words:
- U.S. engine of global innovation for more than 50 years
- Magnet for talent from around the globe
- U.S. Universities at/near the top of global rankings
Slide background image: Photo illustration of Earth from space
Background image credit: John Prusinski, National Science Foundation
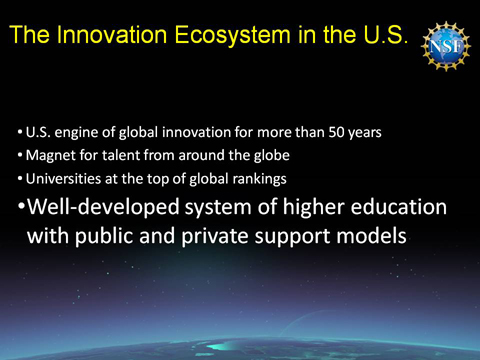
Slide title: The Innovation Ecosystem in the U.S.
Slide words:
- U.S. engine of global innovation for more than 50 years
- Magnet for talent from around the globe
- Universities at the top of global rankings
- Well-developed system of higher education with public and private support models
Slide background image: Photo illustration of Earth from space
Background image credit: John Prusinski, National Science Foundation
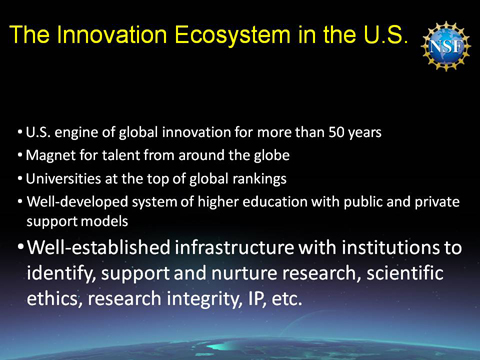
Slide title: The Innovation Ecosystem in the U.S.
Slide words:
- U.S. engine of global innovation for more than 50 years
- Magnet for talent from around the globe
- Universities at the top of global rankings
- Well-developed system of higher education with public and private support models
- Well-established infrastructure with institutions to identify, support and nurture research, scientific ethics, research integrity, IP, etc.
Slide background image: Photo illustration of Earth from space
Background image credit: John Prusinski, National Science Foundation

Slide title: The Innovation Ecosystem in the U.S.
Slide words:
- U.S. engine of global innovation for more than 50 years
- Magnet for talent from around the globe
- Universities at the top of global rankings
- Well-developed system of higher education with public and private support models
- Well-established infrastructure with institutions to identify, support and nurture research, scientific ethics and integrity
- Unique models for university-industry-national lab interactions
Slide background image: Photo illustration of Earth from space
Background image credit: John Prusinski, National Science Foundation
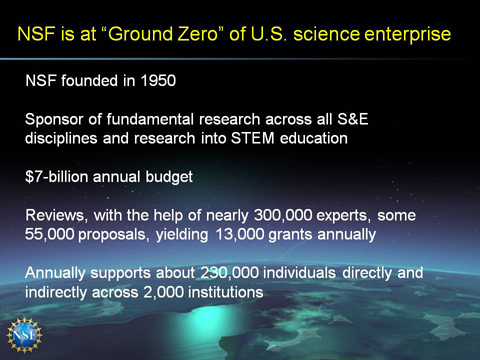
Slide title: NSF is at "Ground Zero" of U.S. science enterprise
Slide words:
NSF founded in 1950
Sponsor of fundamental research across all S&E disciplines and research into STEM education
$7-billion annual budget
Reviews, with the help of nearly 300,000 experts, some 55,000 proposals, yielding 13,000 grants annually
Annually supports about 230,000 individuals directly and indirectly across 2,000 institutions
195 Nobel Laureates supported by NSF since 1950
Economic and societal impact
Slide background image: Photo illustration of Earth from space
Background image credit: John Prusinski, National Science Foundation
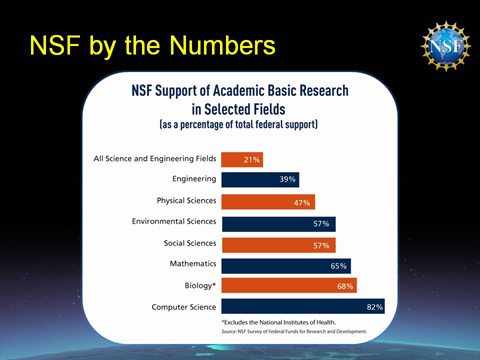
Slide title: NSF by the Numbers
Slide image: Bar graph called "NSF Support of Academic Basic Research in Selected Fields (as a percentage of total federal support)"
All Science and Engineering Fields 21%
Engineering 39%
Physical Sciences 47%
Environmental Sciences 57%
Social Sciences 57%
Mathematics 65%
Biology* 68% [*Excludes the National Institutes of Health.]
Computer Science 82%
Source: NSF Survey of Federal Funds for Research and Development.
Slide background image: Photo illustration of Earth from space
Background image credit: John Prusinski, National Science Foundation

Slide title: National R&D Expenditures and Share of World Total, by Region: 2007
Slide words: Billions of U.S. PPP Dollars
PPP = purchasing power parity
World total = $1,107
Slide image: World map showing worldwide R&D expenditures in 2007 in billions of U.S. PPP (purchasing power parity) dollars
North America: $393 (35.5%)
South America & Caribbean: $26 (2.4%)
Europe (Western, Central, Eastern): $313 (28.2%)
Africa & Middle East: $15 (1.3%)
Asia (East, South, West): $343 (31.0%)
Pacific: $18 (1.6%)
Image source: National Science Board, Science and Engineering Indicators 2010
Slide background image: Photo illustration of Earth from space
Background image credit: John Prusinski, National Science Foundation
Slide title: World of Ideas — Patents
Image not available
Slide background image: Photo illustration of Earth from space
Background image credit: John Prusinski, National Science Foundation

Slide title: Percentage of Undergraduate Degrees in the Natural Sciences and Engineering
Slide image: Bar graph showing the percentage of undergraduate degrees in the natural sciences and engineering in Asia, Europe, and the United States (for 2006 or the most recent year).
In Asia: percentage of natural sciences degrees is around 13%; percentage of engineering degrees is around 21%
In Europe: percentage of natural sciences degrees is around 10%; percentage of engineering degrees is around 11%
In the United States: percentage of natural sciences degrees is around 11%; percentage of engineering degrees is around 4%
Source: National Science Board, Science and Engineering Indicators 2010. U.S. Census Bureau, 1999: . U.S. Census Bureau. 1999; available online at http://www.census.gov/mso/www/pres_ lib/1999pop18/800x600/slide5.html
Slide background image: Photo illustration of Earth from space
Background image credit: John Prusinski, National Science Foundation

Slide title: Percentage of Undergraduate Degrees in the Natural Sciences and Engineering
Slide image: Bar graph showing the percentage of undergraduate degrees in the natural sciences and engineering in Asia, Europe, and the United States (for 2006 or the most recent year).
In Asia: percentage of natural sciences degrees is around 13%; percentage of engineering degrees is around 21%
In Europe: percentage of natural sciences degrees is around 10%; percentage of engineering degrees is around 11%
In the United States: percentage of natural sciences degrees is around 11%; percentage of engineering degrees is around 4%; 1.5% women engineers
Source: National Science Board, Science and Engineering Indicators 2010. U.S. Census Bureau, 1999: . U.S. Census Bureau. 1999; available online at http://www.census.gov/mso/www/pres_ lib/1999pop18/800x600/slide5.html. A
Slide background image: Photo illustration of Earth from space
Background image credit: John Prusinski, National Science Foundation

Slide title: First-year Undergraduate students ....
Slide image: Line graph comparing the number of first-year undergraduate students in EU, Japan and the US to China from 2002 to 2009 (in millions)
EU, Japan and US: around 6 million in 2002; around 6.5 million in 2009 [values for 2008-2009 estimated for EU+US+JP]
China: around 3.2 million in 2002; around 6.4 million in 2009
Values for 2008-2009 estimated for EU+US+JP
Sources:
DB Research, Eurostat
National Statistics of China, 2010
"Research Follows Production," February 2011; E-conomics, Deutsche Bank Research
Slide background image: Photo illustration of Earth from space
Background image credit: John Prusinski, National Science Foundation
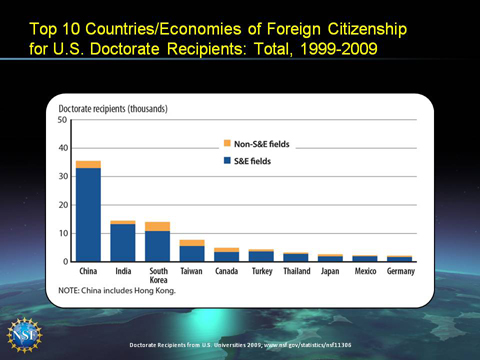
Slide title: Top 10 Countries/Economies of Foreign Citizenship for U.S. Doctorate Recipients: Total, 1999-2009
Slide image: Bar graph showing the top ten foreign sources of U.S. doctorate recipients from 1999 to 2009. The total number of doctorate recipients (in thousands) includes S&E fields, as well as non-S&E fields. The top country is China, which includes Hong Kong, with 35,520 doctorate recipients (S&E fields: 32,973, Non-S&E fields: 2,547). The other countries or economies are the following in descending order:
*India (14,505; S&E fields: 13,266; Non-S&E fields: 1,239)
*South Korea (14,051; S&E fields: 10,824; Non-S&E fields: 3,227)
*Taiwan (7,769; S&E fields: 5,572; Non-S&E fields: 2,197)
*Canada (4,958; S&E fields: 3,455; Non-S&E fields: 1,503)
*Turkey (4,403; S&E fields: 3,658; Non-S&E fields: 745 )
*Thailand (3,286; S&E fields: 2,802; Non-S&E fields: 484 )
*Japan (2,651; S&E fields: 1,935; Non-S&E fields: 716)
*Mexico (2,322; S&E fields: 1,965; Non-S&E fields: 357) and
*Germany (2,196; S&E fields: 1,698; Non-S&E fields: 498)
Slide image source: Doctorate Recipients from U.S. Universities 2009;www.nsf.gov/statistics/nsf11306
Slide background image: Photo illustration of Earth from space
Background image credit: John Prusinski, National Science Foundation
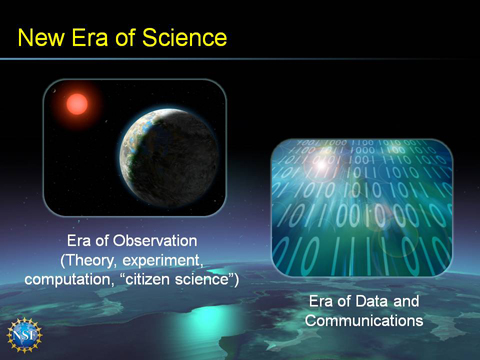
Slide title: New Era of Science
Slide words:
Era of Observation (Theory, experiment, computation, "citizen science")
Era of Data and Communication
Slide images: Artist's conception showing the inner four planets of the Gliese 581 system and their host star, a red dwarf star only 20 light years away from Earth (left); illustration of zeros and ones (right)
Image credits: Lynette Cook (left); © 2011 Jupiterimages Corporation (right)
Slide background image: Photo illustration of Earth from space
Background image credit: John Prusinski, National Science Foundation
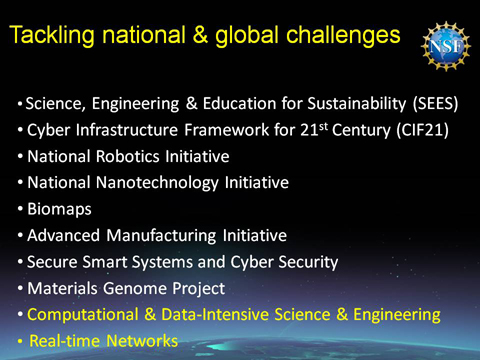
Slide title: Tackling national & global challenges
Slide words:
- Science, Engineering & Education for Sustainability (SEES)
- Cyber Infrastructure Framework for 21st Century (CIF21)
- National Robotics Initiative
- National Nanotechnology Initiative
- Biomaps
- Advanced Manufacturing Initiative
- Secure Smart Systems and Cyber Security
- Materials Genome Project
- Computational & Data-Intensive Science & Engineering
- Real-time Networks
Slide background image: Photo illustration of Earth from space
Background image credit: John Prusinski, National Science Foundation
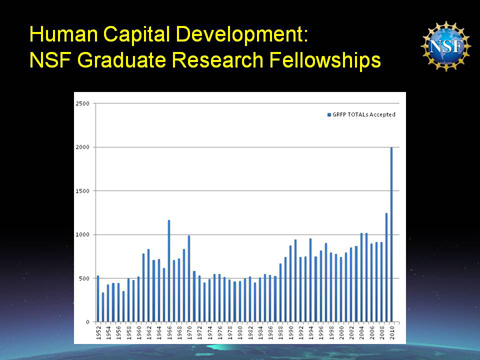
Slide title: Human Capital Development: NSF Graduate Research Fellowships
Slide words: GRFP TOTALS Accepted [Graduate Research Fellowship Program (GRFP)]
Slide image: Line graph showing the total number of Graduate Research Fellowships accepted from 1952 to 2010.
Some of the totals follow:
1952: 533
1960: 520
1966: 1166
1970: 986
1980: 466
1990: 872
2000: 741
2006: 900
2010: 1998
Image credit: National Science Foundation
Slide background image: Photo illustration of Earth from space
Background image credit: John Prusinski, National Science Foundation

Slide title: NSF Innovation Corps
Slide words: Launched July 28, 2011
First 21 projects announced October 5, 2011
Slide images: NSF and I-Corps logos (top left); photo of four scientists around a computer (top right); digital composite of a woman looking at seedlings (bottom left); digital illustration of fingers holding a spark (bottom right)
Image credits: NSF (logos); © 2011 JupiterImages Corporation
Slide background image: Photo illustration of Earth from space
Background image credit: John Prusinski, National Science Foundation

Slide title: The Ditch of Death
Slide image: Diagram entitled "I-Corps 'Home'" showing resources invested from discovery to development to commercialization by universities, small business, foundations, investors and industry.
Resources invested are: NSF overall, STC, GOALI, ERC, AIR/PFI, I/UCRC, I-Corps, STTR, SBIR.
Other words on the graph are "Ditch of Death" and Valley of Death
Image credit: National Science Foundation
Slide background image: Photo illustration of Earth from space
Background image credit: John Prusinski, National Science Foundation
Slide title: PEER: Partnerships for Enhanced Engagement in Research
Slide words: Launched July 7, 2011
Slide images: Logo of the United States Agency for International Development (USAID) (left); NSF logo (right)
Slide background image: Photo illustration of Earth from space
Background image credit: John Prusinski, National Science Foundation
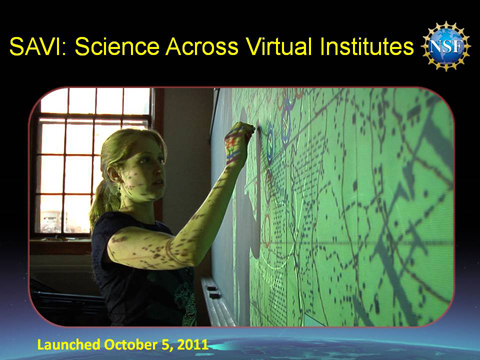
Slide title: SAVI: Science Across Virtual Institutes
Slide words: Launched October 5, 2011
Slide image: photo of a girl writing on a board that has an image projected onto it
Image credit: Richard Lerner
Slide background image: Photo illustration of Earth from space
Background image credit: John Prusinski, National Science Foundation
Slide title: NSF Global Merit Review Summit
May 2012, Washington DC
Slide image: Photo showing two business people silhouetted against a wall of international flags
Slide image credit: © 2008 JupiterImages Corporation
Slide background image: Photo illustration of Earth from space
Background image credit: John Prusinski, National Science Foundation