
All Images
News Release 14-132
Laying the groundwork for data-driven science
NSF announces $31 million in awards to develop tools, cyberinfrastructure and best practices for data science
This material is available primarily for archival purposes. Telephone numbers or other contact information may be out of date; please see current contact information at media contacts.
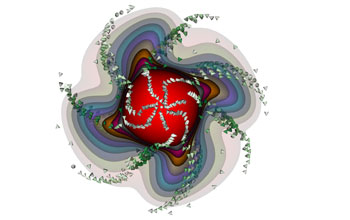
This image and related research data--one of numerous projects being shared and stored using SeedMe--shows a simple model of a geodynamo used for benchmark codes. The view is from the center towards one of the poles, and the cones show convective flow towards higher temperature (light green to dark green with increasing velocity) in a spiraling form caused by rotation. The shells of various colors depict temperature, increasing from the outer boundary towards the interior.
Credit: Amit Chourasia, UC San Diego; Ashley Willis, University of Sheffield; Maggie Avery, UC San Diego; Chris Davies, UC San Diego/University of Leeds; Catherine Constable, UC San Diego; David Gubbins, University of Leeds.
Download the high-resolution PNG version of the image. (842.8 KB)
Use your mouse to right-click (Mac users may need to Ctrl-click) the link above and choose the option that will save the file or target to your computer.
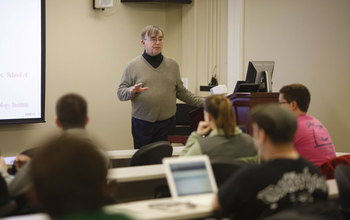
Indiana University professor Geoffrey Fox will lead a DIBBS program team focusing on analytics libraries for scalable data science.
Credit: Indiana University
Download the high-resolution JPG version of the image. (123.8 KB)
Use your mouse to right-click (Mac users may need to Ctrl-click) the link above and choose the option that will save the file or target to your computer.
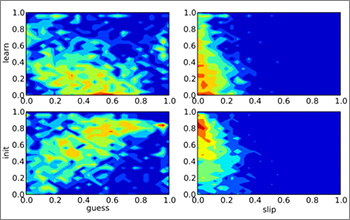
The LearnSphere project led by Carnegie Mellon University seeks to improve educational outcomes by upgrading the infrastructure for educational data mining. Summarizing data from 8,341 students doing online math problems involving 2,400 skills, these heatmaps illustrate relationships between four underlying measures of student performance and learning: prior knowledge, learning rate, guess rate and slip rate. These measures are used to identify student strengths and weaknesses so educators and educational technology can more efficiently personalize the learning experience for students.
Credit: Steven Ritter, Carnegie Learning
Download the high-resolution JPG version of the image. (87.8 KB)
Use your mouse to right-click (Mac users may need to Ctrl-click) the link above and choose the option that will save the file or target to your computer.