
All Images
News Release 12-005
Gulf of Mexico Topography Played Key Role in Bacterial Consumption of Deepwater Horizon Spill
Scientists document how geology, biology worked together after oil disaster
This material is available primarily for archival purposes. Telephone numbers or other contact information may be out of date; please see current contact information at media contacts.

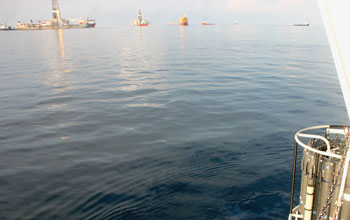
Vessels and platforms responding to the Deepwater Horizon spill in 2010.
Credit: David Valentine
Download the high-resolution JPG version of the image. (570 KB)
Use your mouse to right-click (Mac users may need to Ctrl-click) the link above and choose the option that will save the file or target to your computer.

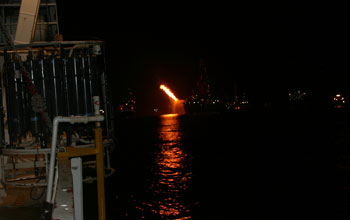
Flaring of natural gas captured at the ruptured Gulf of Mexico well.
Credit: David Valentine
Download the high-resolution JPG version of the image. (3 MB)
Use your mouse to right-click (Mac users may need to Ctrl-click) the link above and choose the option that will save the file or target to your computer.
Recovery in June 2010 of a water sampling device at the Gulf of Mexico oil spill.
Credit: David Valentine
Download the high-resolution JPG version of the image. (1.4 MB)
Use your mouse to right-click (Mac users may need to Ctrl-click) the link above and choose the option that will save the file or target to your computer.
Night-time recovery of a sampling device at the site of the Deepwater Horizon incident.
Credit: David Valentine
Download the high-resolution JPG version of the image. (769 KB)
Use your mouse to right-click (Mac users may need to Ctrl-click) the link above and choose the option that will save the file or target to your computer.
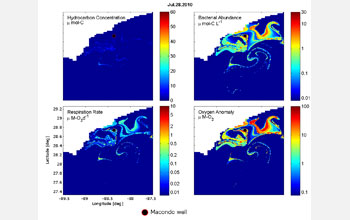
Model results of 26 hydrocarbon compounds at the 1,000- to 3,000-meter depth interval.
Credit: David Valentine et al.
Download the high-resolution JPG version of the image. (562 KB)
Use your mouse to right-click (Mac users may need to Ctrl-click) the link above and choose the option that will save the file or target to your computer.
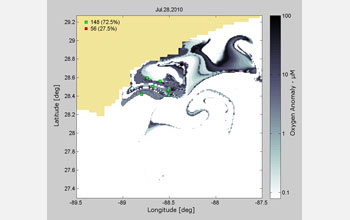
Oxygen anomalies at the 1,000- to 3,000-meter depth interval; spill location is black circle.
Credit: David Valentine
Download the high-resolution JPG version of the image. (266 KB)
Use your mouse to right-click (Mac users may need to Ctrl-click) the link above and choose the option that will save the file or target to your computer.