
All Images
Research News
A Volcanic Idea to Reverse Climate Change

The eruption of Mount St. Helens in 1980.
Credit: Austin Post, USGS
Download the high-resolution JPG version of the image. (48 KB)
Use your mouse to right-click (Mac users may need to Ctrl-click) the link above and choose the option that will save the file or target to your computer.
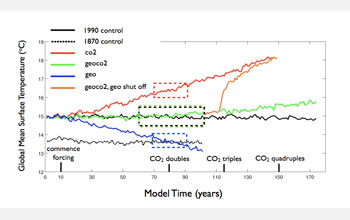
Time series of globally-averaged surface temperatures for various simulations. The green line shows that as a sulfate layer is ramped along with carbon dioxide, global mean temperature can be held close to 1990 values. Additionally, the orange line illustrates the rapid rise in temperature that occurs if geoengineering with a sulfate layer is terminated, but carbon dioxide levels are still high.
Credit: Courtesy of Cecilia Bitz, University of Washington
Download the high-resolution JPG version of the image. (191 KB)
Use your mouse to right-click (Mac users may need to Ctrl-click) the link above and choose the option that will save the file or target to your computer.
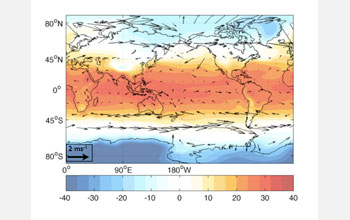
In color is the annually averaged surface temperature over the planet, overlain with the change in winds at 850 millibars due to increased carbon dioxide and a stratospheric sulfate layer. The magnitude of these atmospheric circulation changes, especially over the Southern Ocean, is similar to that induced by just an increase in carbon dioxide.
Credit: Courtesy of Cecilia Bitz, University of Washington
Download the high-resolution JPG version of the image. (73 KB)
Use your mouse to right-click (Mac users may need to Ctrl-click) the link above and choose the option that will save the file or target to your computer.